Download

1 / 25
250 likes | 424 Views
Thermal Mapping for MDSS. Leon Shneider and Andy McDonald Vaisala Road Weather Systems. Thermal Mapping. Across a highway network in winter some sections will be warmer or colder than others Thermal Mapping identifies where these warm and cold sections are going to occur

E N D
Thermal Mapping for MDSS Leon Shneider and Andy McDonald Vaisala Road Weather Systems
Thermal Mapping • Across a highway network in winter some sections will be warmer or colder than others • Thermal Mapping identifies where these warm and cold sections are going to occur • Road pavement temperature data are collected automatically every 5’ under a range of different weather types
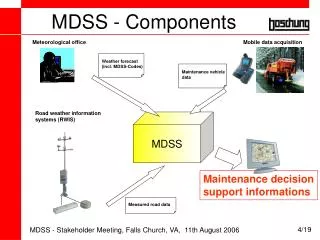
Benefits of Thermal Mapping to MDSS • MDSS provides point forecasts of expected road pavement temperature at a limited number of points • Thermal Mapping provides a series of relative temperature maps to show how much warmer or colder the rest of the highway will be in relation to the forecast points • Together - Thermal Mapping and point forecasts provide a complete highway network forecast of road pavement temperature • Thermal Mapping is especially useful as a tool in the prediction of likely areas for ICE and FROST • During February 2003 a series of Thermal Mapping surveys were undertaken on the MDSS trial area around Des Moines with the support of Iowa DoT……the results follow
Thermal Mapping – Des Moines • NETWORK DETAILS • Iowa DoT selected 15 winter maintenance routes to be used in the MDSS demonstration. • Thermal Mapping was carried out along the entirety of the MDSS Winter Maintenance Routes. • The MDSS Routes total approximately 192 miles. • The Thermal Mapping surveys totalled c. 260 miles (inc. dead/free running etc). • SURVEY DETAILS • 18-19 Feb 03 Extreme Weather Conditions • 19-20 Feb 03 Extreme Weather Conditions • 20-21 Feb 03 Intermediate Weather Conditions • 21-22 Feb 03 Damped Weather Conditions
ESS Location, I35: Variable pavement temperature profile
Thermal Fingerprint Example US Route 30 West onto I35 South Cold Bridge
Des Moines Thermal Mapping Summary • Winter road pavement temperatures varied by more than 14°F (including bridge decks) • Large decreases in pavement temperature of 5°F or more can be seen when driving off the Interstate onto smaller, less trafficked State roads • The positions of existing RWIS sites in the trial area are generally confined to warm sections of highway. There are much colder sections on the road network • Combining point forecasts with Thermal Maps would provide a complete picture of road pavement temperature • An example Thermal Mapping case study follows……..
A82 Invergarry A889 Catlodge A86 Roybridge A86 Tullochroam A9 Drumochter A82 Spean Bridge A9 Calvine A82 Altnafeadh A9 Dunkeld A82 Tyndrum A85 Glen Ogle A9 Inveralmond
Analysis of Data (Forecast) – 21/22 March 2003 Note: Data from A85 Toft and A85 McAras Brae unavailable
Analysis of Data (Results) – 21/22 March 2003 Note: Data from A85 Toft and A85 McAras Brae unavailable
Thermal Maps • How Accurate? • Within 3°F provided the weather station forecast used is within 3°F of the actual • How Do I Use the Information? • Traditionally used to identify: • Will any part of the network fall below zero? • What will the minimum network temperature be? • Used as a critical element in determining if treatment action required
TimeStep Maps - Forecast • Are a new evolution of Thermal Mapping • Provide hourly time steps of forecast network surface temperature from 2200hrs to 0800hrs • Identify not only the minimum temperature BUT which roads will fall below freezing first and when • Facilitate fine tuning of treatment decisions – when should the treatment start to ensure roads are treated BEFORE the freezing point is reached