Download
1 / 54
540 likes | 693 Views
Rapid and Torch Rivers. August 2013 ESLA. Issue: Increasing Sediment 1993 – Aarwood to Torch River. Issue: Increasing Sediment 2005 – Aarwood to Torch River. Issue: Increasing Sediment 2011 – East and West of Aarwood Bridge. Rugg Pond 2011. Torch River/Lake Skegemog 1938.

E N D
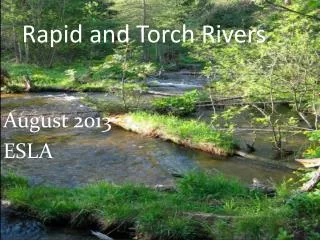
Rapid and Torch Rivers August 2013 ESLA
Issue: Increasing Sediment2011 – East and West of Aarwood Bridge
Why gather data? Removing sediment from our Rivers will most likely be very expensive and require approval from the Michigan Department of Environmental Quality and the Department of Natural Resources. Both of these agencies and and organizations that will potentially consider providing grant funds for addressing our sediment issues will want to know information about the health of our Rivers and about the sources of sediment both naturally occurring and manmade. We need data to support grant fund requests!!
Objectives 2011 and 2012 • Conduct semiannual macroinvertebrate collections at an increasing number of sites • Walk the river and identify major erosion sites • Establish multiple ongoing data collection sites • Evaluate road crossings • Apply for funding to address road crossing issues • MSU led hydrology team to evaluate sediment depositions in Rapid River and Torch River
Most Recent Macroinvertebrate Results • West of Aarwood Bridge – Poor (2012) • East of Aarwood Bridge – Poor (2012) • West of Freedom Park – Fair (2012) • East of Freedom Park – Fair (2012) • East of Kellogg Bridge – Fair (2012) • East of Underhill Road – Poor (2010) • Seven Bridges – Good (2012) • Wood Road west of Rugg Pond – Fair (2012) • Wood Road northeast of Rugg Pond – Poor (2012) • Birch Street northeast of Rugg Pond – Poor (2011)
Walking the River • The ESLA Teams walked the length of Rapid River from Rugg Pond to Torch River. • The length of this stretch by Valley Road is 8.1 miles, but walking the meandering River is probably twice that length or more. • Other than road crossings, only two erosion sites were identified as caused by human intervention, both in the 7 Bridges area. • Other erosion was natural and minor, such as under cutting of banks – vegetation on the banks was very heavy throughout this stretch of the River.
Establish Ongoing Data Collection Sites • Transducer placed at the Rapid City Road crossing – collects water level and temperature data every 30 minutes 24 hours a day. • 4 staff gauges installed - Freedom Park, Wood Road NW, Seeley Road, and 131 Bridge – periodic measurements at these sites include water level, water velocity, suspended sediments, and dissolved oxygen. • Temperature loggers also installed at the above sites, plus Hansen Road and west of Aarwood Bridge.
Ponding behind an undersized culvert At Priest Rd - headwaters
Very steep approaches with washed out berms
WOOD RD NE Improvements by Kalkaska County Road Commission Fall 2011
WOOD RD NE Improvements by Kalkaska County Road Commission Fall 2011
S.W.A.T. AnalysisPaul Richards Ph.D. • Soil Water Assessment Tool • Model applies soil data and land cover data to estimated sediment loading into the Rapid River • Most sediment loading is occurring in: • Kellog Rd (subbasin 16) - 735 tons/yr/km2 • Rapid City Rd (subbain 17) - 220 tons/yr/km • Underhill Rd (subbasin 15) - 163.6 tons/yr/km2 • 4,000 tons of sediment reach Rapid City Rd. each year • 3,000 tons reach Aawood Bridge • 1,000 tons reach Torch River each year
Project Partners • Funders: • Elk Skegemog Lakes Association • Three Lakes Association • Field and lab associates from MSU: • Lon Cooper, Blaze Budd, and Jordan Hein • Local volunteers: • Dean Branson, Bob Kingon, Fred Sittel • Co-Investigators: • Brett Fessell and Frank DituriGrand Traverse Band of Chippewa and Ottawa Indians • Kevin CronkTip of the Mitt Watershed Council • Paul RichardsState University of New York, Brockport
Project Elements • Watershed sediment source modeling • Surveying historical condition • Field campaign • Channel depths • Stream flows • Stream and lake elevations • Make recommendations for management options
Aerial Photo Analysis 1938 1998