Download
1 / 42
420 likes | 520 Views
Learn about the historical perspective, current status, and impacts of the 2010-2013 drought in the High Plains region, including financial losses, wildfire impacts, and agricultural challenges.

E N D
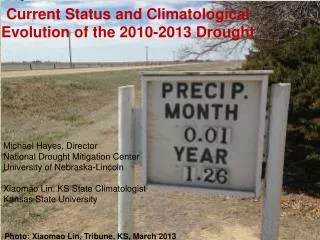
Current Status and Climatological Evolution of the 2010-2013 Drought Michael Hayes, Director National Drought Mitigation Center University of Nebraska-Lincoln Xiaomao Lin, KS State Climatologist Kansas State University Photo: Xiaomao Lin, Tribune, KS, March 2013
Outline • Temporal and spatial context • U.S. Drought Monitor • Current status • Kansas State Climatologist • Next talk: Doug Kluck Summer 2013 High Plains Drought Outlook and Assessment Forum July 24, 2013 Colby, Kansas Photo: Xiaomao Lin, Tribune, KS, March 2013
Percentiles and the U.S. Drought Monitor • Advantages of percentiles: • Can be applied to most parameters • Can be used for any length of data record • Puts drought in historical perspective • D4, Exceptional Drought: once per 50 to 100 years • D3, Extreme Drought: once per 20 to 50 years • D2, Severe Drought: once per 10 to 20 years • D1, Moderate Drought: once per 5 to 10 years • D0, Abnormally Dry: once per 3 to 5 years Courtesy: Brad Rippey, USDA
Continental U.S., Percent in DroughtJanuary 2000 to March 2013 D0 D1 D2 D3 D4 Courtesy: Brad Rippey, USDA
High Plains Region, Percent in DroughtJanuary 2000 to March 2013 Plains Drought, 2001-2005 Plains Drought, 2006-2008 D0 D1 D2 D3 D4 Courtesy: Brad Rippey, USDA
2011 Drought Impacts • NCDC: total direct losses to crops, livestock, and timber = $12 billion • NCDC: losses from wildfires in Arizona, New Mexico, and Texas exceeds $1 billion • Largest wildfires in history in both New Mexico (Las Conchas) and Arizona (Wallow) • Texas: Bastrop County fire Labor Day Weekend destroyed 1,625 homes and caused $325 million in insured losses
Drought Impact Reporter http://droughtreporter.unl.edu
2012 Drought Impacts • Economic loss estimates • $30 billion, NCDC • Crop indemnities: $17 billion • 2011 the previous record with $10.8 billion • Fires • Colorado
Drought Impact Reporter http://droughtreporter.unl.edu
Drought Impact Reporter http://droughtreporter.unl.edu
Courtesy: Kansas Water Office, Weekly Drought Update, July 19, 2013
How Much Water Vapor in Kansas Air ( 2m ) Courtesy: Xiaomao Lin, Kansas State University
Water Anomaly in Air ( 2m ) in June 2012 and 2013 Courtesy: Xiaomao Lin, Kansas State University
How Much Water in Kansas Soil (0-10cm) Courtesy: Xiaomao Lin, Kansas State University
Water Anomaly in Soil ( 2m ) in June 2012 and 2013 Courtesy: Xiaomao Lin, Kansas State University
Southwest Kansas Available Water (Garden City) How much water demand for our irrigation? Courtesy: Xiaomao Lin, Kansas State University
Western and Central Kansas Drought Indices during Past 118 Years (1895 to 2012) Courtesy: Xiaomao Lin, Kansas State University
Summary • A relatively wet period preceded the current dryness that the region is experiencing • Southern Kansas and southeastern Colorado are in their 3rd year of drought; the rest of Kansas, Nebraska, and Colorado are in their 2nd year of drought • Improvements in 2013 in the eastern Corn Belt • Little improvement west of the Missouri River • Livestock sector continues to be hit hard
Michael Hayes National Drought Mitigation Center mhayes2@unl.edu http://drought.unl.edu Xiaomao Lin Kansas State xlin@ksu.edu Photo: Xiaomao Lin, Tribune, KS, March 2013