Download
1 / 34
340 likes | 440 Views
Explore the impact of population aging on travel patterns using an activity-based travel demand model. Data from the U.S. Census Bureau and three aging scenarios are analyzed to understand changes in transportation behavior. The study evaluates how aging affects modes of transportation, daily miles traveled, and travel purposes. Utilizing the Activity-Based Model (ABM) allows for detailed simulation of individual travel behavior, addressing socio-demographic changes and spatial considerations. Findings highlight the importance of considering aging demographics in transportation planning for the future.

E N D
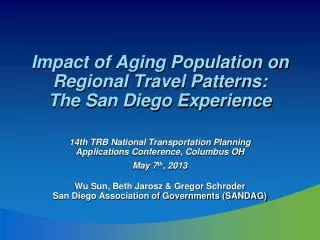
Impact of Aging Population on Regional Travel Patterns:The San Diego Experience 14th TRB National Transportation Planning Applications Conference, Columbus OH May 7th, 2013 Wu Sun, Beth Jarosz & Gregor Schroder San Diego Association of Governments (SANDAG)
Background • Population Aging • Activity-Based Travel Demand Model (ABM) • Evaluate Impact of Aging Population on Travel Patterns Using ABM
U.S. Population Aging Source: U.S. Census Bureau, decennial census 1970, 1980, 1990, 2000, and 2010
In 25 years, Boomers will nearly double the population age 65+ Source: U.S. Census Bureau, Projections (2012) ,“Constant International Migration Series”
3 sources of change • Life-course • Generational • Broad social/economic trends
Life-course: disability status by age Source: U.S. Census Bureau, ACS 2011
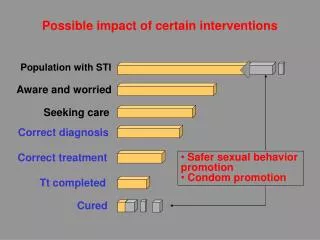
Time of Day: Older Drivers Report Avoiding Certain Driving Conditions • Older drivers likely to avoid driving: • at night • in bad weather • in heavy traffic • Some avoidance of highway driving • Time-shifting of trips to avoid congested periods Source: U.S. Centers for Disease Control and Prevention, “New Data on Older Drivers,” April 19, 2011
Mode share: Means of Transport to Work by Age (2007-09) Source: U.S. Census Bureau, ACS 2011
Aggregate System Effects: Average Daily Miles of Travel Sources: U.S. Department of Transportation, Federal Highway Administration, 1983, 1995, 2001, and 2009 National Household Travel Survey.
Methodology • Generation of 3 aging scenarios • ABM-A travel forecast model sensitive to socio-demographic changes • Generation of a synthetic population
Generation of Aging Scenarios: Data • 2010 Census • 2035 Forecast – 3 scenarios • Base case: derived from SANDAG 2050 Regional Growth Forecast (2010) • Older population: 2.3% increase in population over age 65, compared with base case, offset by fewer persons age 64 and younger (with most change under age 18) • Younger population: 2.2% decrease in population over age 65, compared with base case, offset by fewer persons age 64 and younger (with most change under age 18) • Geography: • San Diego County • Unit of analysis: approximately 23,000 census block level geographies known as Master Geographic Reference Areas (MGRAs)
Aging Scenarios Source: SANDAG, 2050 Regional Growth Forecast (2010) and alternate age scenarios
Activity-Based Model (ABM) Land Use Models Transportation System Transportation Policy ABM BorderModel Traffic Assignment CVM Special Models Environmental Impact System Performance Economic Analysis
Why ABM? • Simulate travel behavior individually • Detailed temporal & spatial resolutions • Sensitive to socio-demographic changes • Increased Sensitivity • Environmental Justice / Social Equity • Spatial and network changes • Land use changes
Treatment of Space • MGRA (gray lines) • 21,633 MGRA • 4,682 TAZs MGRA: Master Geographic Reference Area (Grey Lines) TAZ: Transportation Analysis Zone (Orange Line)
Treatment of Time TOD in travel demand modeling • 40 departure half-hours (5AM-24PM) by • 40 arrival half-hours (departure-24PM) TOD in traffic assignment
Treatment of Travel Modes Tour Mode Trip Mode
Treatment of Socio-Demographics • Household characteristics • Household size • Household income • Number of workers per household • Number of children in household • Dwelling unit type • Group quarter status • Person characteristics • Age (0-17, 18-24,25-34, 35-49, 50-64, 65-79, 80+ ) • Gender • Race
Population Synthesizer (PopSyn) • Synthetic population: • a collection of records that represents household and person characteristics • Foundation of individual behavioral simulation based model such as ABM
PopSyn Inputs • Census and ACS PUMS • Household and person level microdata • Census and ACS summary data • Source for base year control targets • Source for base year validation data • SANDAG estimates and forecasts • Source for future year control targets • 3 aging scenarios
PopSyn Outputs Household Table PUMS Household Table PUMS Person Table
Results • Mode choice • TOD choice • Tour purposes • Average tour distance/Daily tour distance • VMT (resident households only)
Conclusions • Population aging is a national trend • Impact of population on travel patterns • Evaluate population aging impact on travel using ABM • Say something about analysis results here….