Download
1 / 36
360 likes | 496 Views
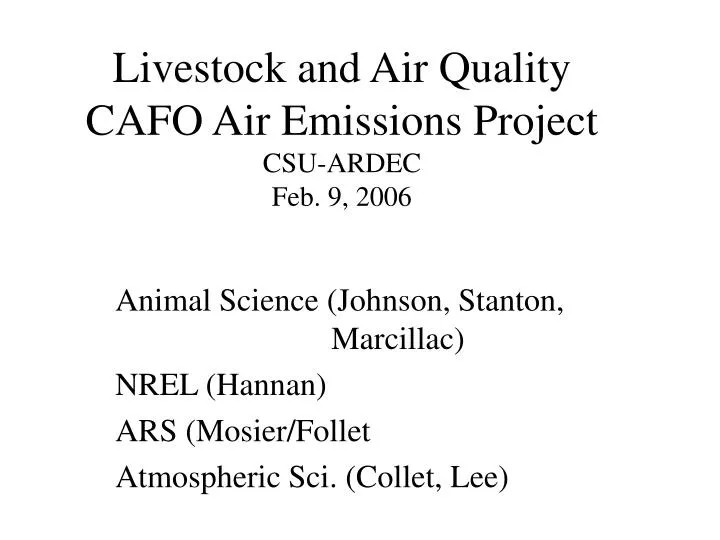
Livestock and Air Quality CAFO Air Emissions Project CSU-ARDEC Feb. 9, 2006. Animal Science (Johnson, Stanton, Marcillac) NREL (Hannan) ARS (Mosier/Follet Atmospheric Sci. (Collet, Lee). National Academy of Science NRC 03 Air Emissions from AFO’s. Commissioned by EPA and USDA

E N D
Livestock and Air Quality CAFO Air Emissions ProjectCSU-ARDEC Feb. 9, 2006 Animal Science (Johnson, Stanton, Marcillac) NREL (Hannan) ARS (Mosier/Follet Atmospheric Sci. (Collet, Lee)
National Academy of ScienceNRC 03 Air Emissions from AFO’s • Commissioned by EPA and USDA • Finding 7: methods and measurements needed for NH3, CH4, H2S, PM’s • Finding 8: Emission factor estimates not adequate • Finding 9: Process-based model development recommended
National Research Initiative USDA 2004 RFP • $ for Air Quality studies • ? How can AFO emissions be measured? • Particularly variable, heterogeneous production systems; e.g., cattle, pens, dams, lagoons, composting of all shapes sizes, etc • We have a team that thinks we can!
Air Emissions from dairy CAFO:multi-scale measurements and process-based modeling • The overall aim: to measure potentially problematic air emissions from cattle production systems and develop process based methods to predict them.
Specific Objectives • 1. Measure emissions from 2 dairies: • Ammonia • PM2.5 • Nitrous oxide • Methane • 2. Determine diurnal, seasonal variations • 3. Develop and challenge process model estimates of emission fluxes
Objectives Contd: • 4. Correlate downwind concentrations of spot sampled emissions - e.g.: H2S, VOC’s..
Approach • Quantification of CAFO System Emissions • Mass Balance
z y Whole-System Trace Gas Fluxes from Complex Agricultural Sources: Plume Characterization and Conservation of Mass x dc/dt Primary wind direction Fe Fl Fd FS F0 F1 FSx,y = dc/dtx,y,z + {F1y,z–F0y,z} + {Flx,z} + {Fex,y+Fdx,y} Plume Lateral Vertical indicates summation across plane or volume indicated by subscripts
Tethersonde Array Ta, q, u, [CO2], [CH4], [N2O], [NH3], PM10, PM2.5 ? FSx,y = {F1y,z – F0y,z} + {Fdx,y} F0 F1 Fd 1 sonde to characterize background profile, 3 (or more) to characterize plume, chemical trap array Sonde telemetry to central computer. Balloon specs: >1 km height, 5 kg payload, auto-deflate
Tethersondes and Air Sampling • Tethersondes at 5 heights; wind-speed, direction, humidity, temperature and pressure. • Sample lines at 5 heights • draw samples to ground for non-reactive gases (CH4, N2O, CO2) • filters attached at each sample height collect NH3, PM2.5, nitric acid. • Sample; 1-2hr, 3X/d, 2 days, 7 seasons, 2yr
Upwind Sample Dairy 1 DW1 DW2 DW3
z y x dc/dt Fluxes F0 and F1: Planes Perpendicular to Wind Direction Ta, q, u, [CO2], [CH4], [N2O], [NH3], PM10, PM2.5 help cz cz F1= ∫ ∫ uy,z cy,zdy dz F0 = y ∫ uz czdz Fluxes estimated by fitting flux velocity planes to measured scalar concentration and wind speed profiles and estimating the integrals
ApproachProcess-based Model • Characterization of Emission Source Components • Animals, diets, pens, manure removal methods, solids separation, lagoons, composting procedures • Prediction of C and N flux through each • Modify whole farm model: • No cropping, add composting, NH4
J W Products and GHG from Cattle Production Herd Cropping Feeds 100 cows + others Manure ( ) + Soil Fuel CH N 0 Carbon 2 4 C0 2
Figure 1. Estimates of source and intensity of greenhouse gas emissions per unit of milk, lbs/lb, by scenario from Colorado dairy cattle systems.
J W Products and GHG from Cattle Production Herd Cropping Feeds 100 cows + others Manure ( ) + Fuel CH 0 N 2 4 C0 2 NH4 PM
Important questions • NH3 amounts by source • NH4, conversion to PM’s • CH4 from lagoons, dams, composting • N2O from each • Variations: diurnal, season, temp, etc
NH3: EPA 04 estimate 2,418,595 t/yr X $1.3 to $21/kg = 3 to 50 $Bill/yr Note: McCubbin 02; 10% Livstk NH3 $4B CH4: EPA 04 estimate: 7.3 Tg/yr X $0.60 to $1.54/kg = 4 to 11 $Bill/yr Total cost of US livestock NH3 and CH4 (Sci. 05, 308:1901)
The next step: Mitigation • Treatment effects; algae, aeration, CuSO4, etc, etc. • Dietary comp: RDP, peptide, Bypass AA’s, CHO source and Kd, etc, etc
All Emission Mitigation Approaches Must: • be based on a comprehensive, life cycle analysis that assesses all emissions; ammonia-PM2.5, greenhouse gases,etc.
Potential for Ammonia reduction • Diet crude protein effect: • Two research report examples: • Kulling,01 Dairy • Cole, 04 Beef
NH3 from manure of steers vs %CP in diet (Cole, et 05) • Manure-soil incubations: • Diet %CP NH3 • Control 14.5 0 • Med 13.0 - 37% • Low 11.5 - 63%
Diet %CP vs Ammonia loss (Kulling,et. 01 J Ag Sci 137:235) • Lactating Cows, 30.9 kg/d, • 3 protein levels, +bypass Methionine 12.5 % • % 17.5 %
Dairy % diet CP vs NH3 Emissions(Kulling 01, J Ag Sci 137:235)
Environmental Stewardship Strategies for Livestock production systems • Reductions in excess N - Primary • Reductions in feed/product • Dilution of maintenance • Reduction of maintenance • Mitigation strategies should consider all emissions