Understanding Exponential Growth: Concepts, Graphs, and Real-World Implications
This article delves into the nature of exponential growth, illustrated through various scenarios such as mutual funds and disease spread. We explore how certain situations start slowly and accelerate dramatically over time. Key concepts include the exponential growth equation, the significance of growth factors, and the illustrative nature of graphs, including asymptotes and x-intercepts. By examining these elements, we provide clarity on the behavior of exponential functions, making it easier to understand their implications in different fields.

Understanding Exponential Growth: Concepts, Graphs, and Real-World Implications
E N D
Presentation Transcript
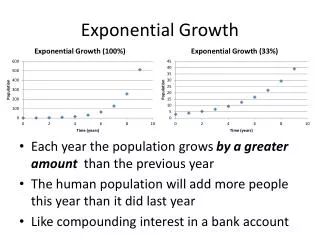
If we graph data from an exponential “situation” it would look like… Road Kill WHAT is it? Unpaid Debt What situations would start growing slowly and then really speed up? Exponential Growth Mutual funds Disease
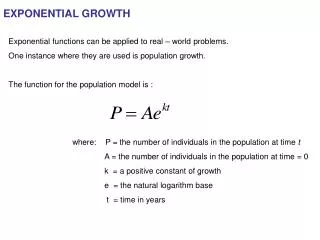
Exponential Growth Equation Beginning amount Notice that the exponent is a variable! Growth factor. (Often a % or uses words like doubling, tripling…
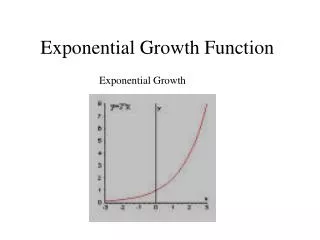
The “parent” graph….. x : none y: (0,1) D: (-∞,∞) R: (0,∞)
The “parent” graph….. x : none y: (0,-1) D: (-∞,∞) R: (0,∞)
WIDER The “parent” graph….. x : none y: (0,1/2) D: (-∞,∞) R: (0,∞)
+ 3 The “parent” graph….. x : none y: (0,4) D: (-∞,∞) R: (3,∞) Up 3 See what y equals if we let x = -100 The 3 at the end of the equation creates an asymptote. An asymptote is like a boundary that the graph gets infinitely close to but NEVER touches.
+ 3 Right 1 The “parent” graph….. x : none y: (0,4) D: (-∞,∞) R: (3,∞) Up 3 What OUT! This family CAN have X-INTERCEPTS.
The “parent” graph….. - 3 Asymptote would be y = - 3.