Download
1 / 41
410 likes | 692 Views
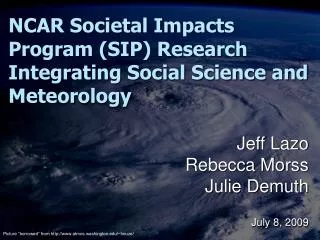
NCAR Societal Impacts Program (SIP) Research Integrating Social Science and Meteorology. Jeff Lazo Rebecca Morss Julie Demuth July 8, 2009. Picture “borrowed” from http://www.atmos.washington.edu/~houze/. Overview. Why integrate meteorology and social sciences?

E N D
NCAR Societal Impacts Program (SIP) Research Integrating Social Science and Meteorology Jeff Lazo Rebecca Morss Julie Demuth July 8, 2009 Picture “borrowed” from http://www.atmos.washington.edu/~houze/
Overview • Why integrate meteorology and social sciences? • What is the Societal Impacts Program (SIP)? • Brief overview of SIP activities • Capacity building • Research • In-depth research discussion • Current hurricane research projects • Current NSF (and partially NOAA) funded research on hurricanes and flash floods • Summary
Meteorology + Social Science: Putting Together the Pieces • Ultimate goal of weather forecasting = to create societal value by providing usableinformation for decision making • For information to be usable, must be • Scientifically sound • Communicated effectively • Interpretable • Actionable • SIP supports these goals through multiple mechanisms
Societal Impacts Program • Overview: • NCAR – RAL, MMM, ISP, COMET • Funded by NCAR, NOAA’s USWRP, external grants • Initiated April 1, 2004 • Objective: • Infuse social science and economic research, methods, and capabilities into the planning, execution, and analysis of weather information, applications, and research directions through: • Information Resources • Weather and Society * Integrated Studies (WAS*IS) • Develop and Support Weather Impacts Community • Primary Research
Information Resources • Extreme Weather Sourcebook – updated to 2008 • $11.6B / year weather damages (1955-2006) • Led to research project on quality of damage data • Weather and Society Watch • 250+ subscribers • Quarterly newsletter – including special issue for AMS mtg. • Always looking for contributions! Any ideas??? • Societal Impacts Program Discussion Board • 250+ participants
Weather and Society * Integrated Studies (WAS*IS) • Capacity-building program – build an interdisciplinary community & learn about integrating social science & meteorology • 6 workshops, 171 people to date • Upcoming 2009 summer workshop, August 6-14 (NWS sponsored) • Additional WAS*IS-inspired workshops • NWS WAS*IS workshop (October 2007) 2008
WAS*IS-Inspired NWS Integrated Warning Team (IWT) Workshops • WFO Kansas City / Pleasant Hill held 1st IWT (January 2009) • Envisioned, led by Andy Bailey (WCM) with WAS*IS • Build stronger partnerships among NWS, broadcast meteorologists, emergency managers • Introduce and discuss social science • NWS Central Region to continue • IWT in Omaha/Valley (September 2009) • Possibly another in 2009
Develop and Support Weather Impacts Community (Examples) • NOAA • Social Science Working Group • Weather & Water Social Science Strategic Plan • Hurricane Forecast SocioEconomic Working Group NOAA-NSF Call for Proposals American Meteorological Society - Boards, Editorial Boards, Committees, Council • National Research Council • Estimating & Communicating Uncertainty • Multifunction Phased Array Radar • Weather Research Progress and Priorities • World Meteorological Organization • WWRP Social and Economic Research and Applications Working Group • Forum on Social and Economic Applications and Benefits • Economics Primer for Meteorological and Hydrological Services
Overall U.S. Sector Sensitivity Assessment Econometric model of U.S. state-level and sector-level sensitivity to weather variability 24 Years Economics Data 70 Years Weather Data Sensitivity: - Relative: 3.36% - Absolute: $470 billion (2007)
NWS Performance Branch – Brent MacAloney Survey of NWS personnel on Storm Data processes Two part survey Part A - July 2008 – WFO based Data creation Perception of accuracy Additional training/ resources Part B - December 2008 – Event based Storm Data Assessment • Specific estimation for randomly selected recent events • Individual responsible for each event’s loss estimate • Desired Outcomes • Identify training and resource needs • Understand potential bias in loss estimation
300 Billion Served! • Conducted nationwide, web survey on people’s sources, perceptions, uses, and values of weather forecasts • Average respondent gets weather forecasts 115 times per month! • 226 million U.S. adults 300 billion forecasts obtained per year! • N=1465, 3.6% never use weather forecasts
Value of Weather Forecasts • Same nationwide survey asked about people’s willingness-to-pay for NWS services • Median fitted value of $286 per household • 114.4 million households estimated value of forecasts to U.S. public is $31.5 billion
Communication of Forecast Uncertainty • Same survey: Suppose you are watching the news • Channel A: high temperature will be 76°F tomorrow • Channel B: high temperature will be between 74°F and 78°F tomorrow. Prefer Channel A 22% (deterministic) Prefer Channel B 45% (uncertainty) 27% Like both channels 2% Like neither channel 4% I don't know 0% 10% 20% 30% 40% 50% Percent of Respondents
NWS Service Assessments • Super Tuesday Tornadoes • Led social science efforts on • Who died, where, what warning information they had • Survivors’ knowledge, interpretations, and decisions • Partnerships with NWS team members were essential! • Mike Vescio (PDT), Kevin Barjenbruch (SLC), Daniel Nietfeld (OAX) • SIP working with NWS on including social scientists in other Service Assessments • Jen Sprague, Brent MacAloney, Doug Young
Broadcasters’ Views on Forecast Uncertainty • Broadcasters are users and providers of forecast uncertainty … verbally, graphically, numerically • 3 focus groups with 14 broadcast meteorologists at AMS Broadcast Meteorology Conference • Collaboration with Paul Hirschberg, Elliott Abrams, John Gaynor, Betty Morrow in support of AMS ACUF • Results: BAMS InBox article (Demuth et al., in press) “If it’s a complicated forecast, I’ll say that I’m not too sure what’s going to happen. But not with the numbers… We show 3 tombstones. This is what you can expect the next 3 days. And then at the end I show the other 3, but I just kind of brush those off… So there’s a way of expressing uncertainty without having to get into the numbers and PoPs and stuff like that.”
Improving NWS Public Forecasts • NWS web pages accessed millions of times daily • Public forecast information can be inconsistent or misleading, which can lead to suboptimal decisions • Partnering with NWS to integrate social science into evaluation • Joint funding with OST, OCWWS • Collaborating with Doug Hilderbrand, many others
Benefits of Improved Hurricane Forecasting • What is the value to households of potentially improved hurricane forecasts? • Stated-preference method • Stated Choice (conjoint analysis) • Current Survey Development and Empirical Results • 80 subjects • not representative sample • non-random nature of recruiting • small sample size
Benefits of Improved Hurricane Forecasting Survey Outline • personal impact / vulnerability • perceived risk • preparation for hurricane • evacuation decisionmaking • likely impact on household • hurricane forecasts • attributes • perceived accuracy • improved hurricane forecasts • attributes • choice sets • current hurricane forecasts • socio-demographics
Benefits of Improved Hurricane Forecasting • Econometric modeling and analysis – Don Waldman • random utility behavioral model • parameter estimates represent marginal utilities • landfall time, windspeed, location, storm surge • cost (marginal utility of income) • estimation is by bivariate probit • first choice between A and B • second choice between A/B and “do nothing” • analyzed only choice occasions 2 – 8 • 80 subjects – 7 choices each = 560 “observations” • quadrature to account for intra-subject correlation
Hurricane Forecast Improvement Project HFIP Metrics • Reduce average track error by 50% for Days 1 through 5. • Reduce average intensity error by 50% for Days 1 through 5. • Increase the probability of detection (POD) for rapid intensity change to 90% at Day 1 decreasing linearly to 60% at Day 5, and decrease the false alarm ratio (FAR) for rapid intensity change to 10% for Day 1 increasing linearly to 30% at Day 5. • Extend the lead time for hurricane forecasts out to Day 7
Hurricane Forecast Improvement Project • Socio-Economic Impacts Assessment • Assessment of Emergency Managers - Betty Morrow • in-depth focused interviews • emergency managers • stakeholder communities (hospitals / transportation / etc) • Household valuation – Jeff Lazo • non-market stated choice assessment • adapted Benefits of Improved Hurricane Forecasting • attribute set from HFIP • 400 sample across the vulnerable region
SIP’s NSF- and NOAA- Funded Research on Hurricanes and Flash Floods
Warning Decisions in Extreme Weather Events (WDEWE) • 3-year NSF-funded study • How are warnings communicated, obtained, interpreted, and used in decision making by participants in the warning process? • Role of uncertainty in information dissemination and decision making • Factors influencing organizational and public decision making and actions • Public preferences for attributes of forecast and warning information
WDEWE Collaborators & Participants • Multi-disciplinary research team • Meteorology, economics, sociology, risk communication and decision analysis • NCAR, CU Hazards Center, Univ. of Washington • Key support and collaboration with Larry Mooney, MIC at WFO Denver/Boulder • 4 groups: forecasters, public officials, media, public
WDEWE Methods • Parallel studies: hurricanes in Miami area, flash floods in Boulder area • Multiple methods • In progress (in Boulder) • Interviews (organizational & mental modeling) & survey with forecasters, local officials, media • Planned • Mental modeling interviews with public on perceptions and decision making • Focus groups with officials, media, public on interpretation and use of warning messages • Survey on public on preferences for warning messages • Synthesis and feedback
Communicating Hurricane Info (CHI) • 2-year joint NSF- & NOAA-funded study • How is the content of hurricane forecast and warning messages generated? • What are the channels through which hurricane forecast and warning information is communicated? • How do at-risk people (including vulnerable populations) comprehend and react to specific components of the forecast and warning messages?
CHI Collaborators & Participants • Multi-disciplinary research team • Meteorology, economics, communication, sociology • NCAR, Univ of Oklahoma, Univ of Houston • Key support and collaboration • Jamie Rhome, Storm Surge Team Lead at NHC • Advisory committee of researchers, forecasters, broadcasters • 4 groups: NHC and WFO forecasters, broadcasters, emergency managers, public
CHI Methods • Parallel studies in Miami and Houston areas • Multiple methods • In progress (in Miami): • Interviews and observations with forecasters, broadcasters, emergency managers • Planned • Survey on public access, comprehension, and reaction to messages • Focus groups with vulnerable populations • Laboratory tests of sample messages with public • Synthesis and feedback
Meteorology + Social Science: Putting Together the Pieces • Ultimate goal of weather forecasting = to create societal value by providing usable information for decision-making • Integrated meteorology-social science research is in its infancy!! (Think Ted Fujita studying tornadoes 30-40 years ago!) • We have a long way to go … but it’s an exciting road to travel!
Thank You! Jeff Lazo – lazo@ucar.edu Rebecca Morss – morss@ucar.edu Julie Demuth – jdemuth@ucar.edu www.sip.ucar.edu