Phenological Patterns in California: Insights from the California Phenology Project
The California Phenology Project (CPP), initiated in 2010, investigates the timing of seasonal biological events, such as flowering and leaf-out, in relation to climate variability. Through collaboration with the National Park Service and the USA National Phenology Network, the CPP has monitored over 30 focal plant species across diverse bioclimatic regions in California. Findings include the effects of warmer temperatures on flowering timing and the influence of winter precipitation on phenophase onset, laying crucial groundwork for understanding plant responses to climate change.

Phenological Patterns in California: Insights from the California Phenology Project
E N D
Presentation Transcript
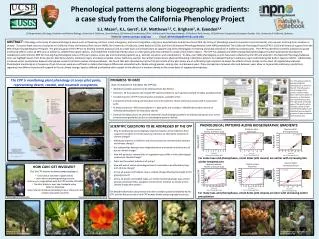
Phenological patterns along biogeographic gradients: a case study from the California Phenology Project S.J. Mazer1, K.L. Gerst2, E.R. Matthews1,3, C. Brigham3, A. Evenden3,4(1) Department of Ecology, Evolution and Marine Biology, University of California, Santa Barbara, (2) National Coordinating Office, USA National Phenology Network, (3) National Park Service, (4) Californian Cooperative Ecosystem Studies Unit, University of California, Berkeley Website: www.usanpn.org/cppEmail: phenology@eemb.ucsb.edu ABSTRACT: Phenology is the study of seasonal biological events such as flowering, leaf-out, insect emergence, and animal migration. Long-term observational studies have found that the timing of phenological events responds to environmental, inter-annual, and long-term variation in climate. To assess these sources of variation on California’s flora, the National Park Service (NPS), the University of California, Santa Barbara (UCSB), and the USA National Phenology Network (USA-NPN) established The California Phenology Project (CPP) in 2010 with financial support from the NPS Climate Change Response Program. The primary goals of the CPP are to develop and test protocols and to create tools and infrastructure to support long-term phenological monitoring and public education in California national parks. The CPP has identified scientific questions to guide monitoring efforts across all NPS units in California, selected focal plant species, and established monitoring infrastructure in seven pilot parks that represent a range of bioclimatic regions. The CPP has adapted and tested standardized phenological monitoring protocols developed in collaboration with the USA-NPN for tracking the phenological status of 30 plant species across key environmental gradients (e.g., latitude, elevation, and precipitation). To date, over 500K phenological records have been collected by the CPP and entered in the National Phenology Database. Here, we highlight results from three species: Baccharispilularis, Sambucusnigra, and Quercuslobata. Across California, warmer late winter temperatures advanced flowering in Baccharispilularis, but delayed fruiting in Sambucusnigraand breaking leaf buds in Quercuslobata. Additionally, increased winter precipitation delayed phenophase onset for all three species and phenophases. We found that data recorded during the first 28 months of the pilot phase are of sufficiently high resolution to detect the effects of local climate on the onset of targeted phenophases. Phenological monitoring at a frequency of two times per week was sufficient to detect phenological differences associated with climate among species, among sites, and between years. These comparisons between sites and between years allow us to generate preliminary predictions regarding how different species will respond to future climate change. Species differed qualitatively with respect to the effects of a warmer climate on the onset dates of targeted phenophases. • PROGRESS TO DATE • Since its initiation in late 2010, the CPP has: • Identified scientific questions to be addressed (see box below) • Selected > 30 focal species and created CPP species profiles for each species (example to right), available online • Created maps for all CPP monitoring sites and plants, available online • Conducted annual training and education events for teachers, citizen scientists and park staff in seven pilot parks • Actively monitored > 950 marked plants in 7 pilot parks and recorded > 500,000 observation records of individual phenophases for focal plant species • Summarized observations to date and examined how phenological patterns of widespread species vary across environmental gradients (seebox on phenological patterns below) photos The CPP is monitoring plant phenology at seven pilot parks, representing desert,coastal, and mountain ecosystems. The CPP species profile for Baccharis pilularis (Coyotebrush) is shown to the left. The left panel is the front page of the profile, which provides basic information about the species (e.g., distribution and ethnobotanical uses). The right panel is the back page of the profile, which includes a photo of each USA-NPN phenophase and additional species-specific guidance in how to observe each phenophases. Joshua Tree NP Santa Monica Mountains NRA Look PHENOLOGICAL PATTERNS ALONG BIOGEOGRAPHIC GRADIENTS • SCIENTIFIC QUESTIONS TO BE ADDRESSED BY THE CPP • How do widespread and ecologically important species of the California flora respond to variation in climate (and, by extension, to alternative scenarios of climate change)? • Which plant species in California are most sensitive to environmental variation and climate change? • Are relationships between inter-dependent plant and animal mutualists at risk due to climate change? • How will particular communities or vegetation types differ in their phenological response to climate change? • What are the earliest indicators of spring? • How will end-of-season phenological events and patterns be affected by long-term climate change? • Across all species and habitats, how is climate change affecting the length of the growing season? • Across all species and habitat types, are certain functional groups (e.g., winter annuals, perennial herbs, evergreen shrubs) more sensitive to climate and to climate change than others? • For detailed information about these and other scientific questions identified by the CPP, visit the Resources tab on the CPP website (www.usanpn.org/cpp/resources). SambucusnigraRipe fruits QuercuslobataBreaking leaf buds BaccharispilularisFlowers and flower buds Santa Monica Mountains NRA p < 0.0037 p < 0.0001 p < 0.0010 Adjusted DOY Adjusted DOY Adjusted DOY Tmin (°C) (Jan of Phenological Year) Tmin (°C) (March of Phenological Year) Tmin (°C) (Jan of Phenological Year) For some taxa and phenophases, onset dates (site means) are earlier with increasing late winter temperatures Lassen Volcanic NP QuercuslobataBreaking leaf buds SambucusnigraRipe fruits BaccharispilularisFlowers and flower buds • HOW CAN I GET INVOLVED?Visit the CPP website at www.usanpn.org/cppto: • Learn about volunteer opportunities • Learn about upcoming training sessions • Partner your organization with the CPP and the USA-NPN • Monitor plants in your own backyard using Nature’s Notebook • Learn how to introduce phenology to your classroom and outdoor education students p < 0.0362 Adjusted DOY Adjusted DOY Adjusted DOY p < 0.0009 p < 0.0372 PPT (mm) (Feb of Phenological Year) PPT (mm) (Jan of Phenological Year) PPT (mm) (Jan of Phenological Year) For many taxa and phenophases, onset dates (site means) are later with increasing winter precipitation Naturebridge, Santa Monica Mtns. Training local citizens at John Muir NHS CPP Monitoring at Santa Monica Mountains NRA Greenleaf manzanita monitoring at Lassen Volcanic NP Pinus ponderosa Lupinusobtusilobus Aesculuscalifornica Eschscholziacalifornica Baccharispilularis Heracleummaximum