Download
1 / 32
320 likes | 414 Views
Explore the response dynamics of I1-FFL and I4-FFL regulatory motifs in genetic networks. Analyze activation, repression, and temporal order in gene expression pathways. Understand the selective advantages of complex regulatory architectures.

E N D
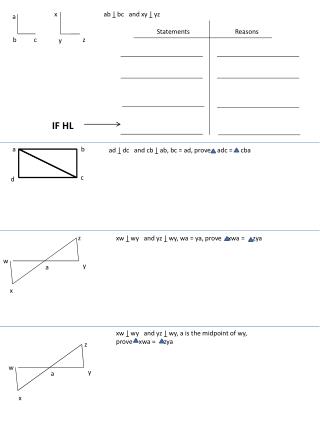
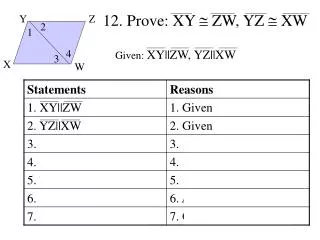
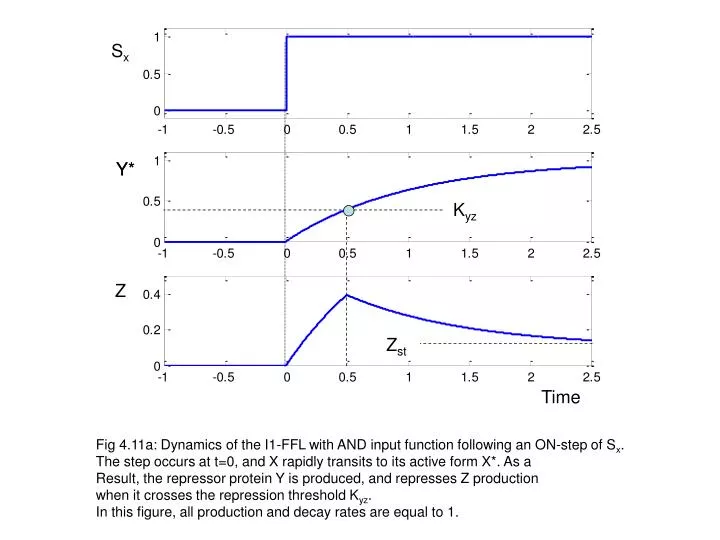
Sx Y* Y* Kyz Z Zst Time Fig 4.11a: Dynamics of the I1-FFL with AND input function following an ON-step of Sx. The step occurs at t=0, and X rapidly transits to its active form X*. As a Result, the repressor protein Y is produced, and represses Z production when it crosses the repression threshold Kyz. In this figure, all production and decay rates are equal to 1.
Trep Fig 4.11b: Expression dynamics of Z in an incoherent type-1 FFL with repression coefficients F=2,5,20. The repression coefficient is the ratio of the maximal expression without active repressor to the steady-state expression with active repressor. Trep is the time when repression begins, and is the moment of maximal Z concentration.
Z / Zst I1-FFL 1.5 1 Simple regulation 0.5 o T1/2 I1-FFL T1/2 (simple reg.) Figure 4.12a: Response time of the I1-FFL is shorter than simple regulation that reaches same steady-state level. The normalized response time of simple regulation is log(2)~0.7. Simple regulation- dashed lines, I1-FFL- full lines)
Figure 4.12b: Response time of the I1-FFL as a function of the repression coefficient F. F is the ratio of unrepressed to repressed Z expression. Green horizontal line: normalized response time of simple regulation, αz T1/2=log(2). Response time αz T1/2 log(2) Ratio of unrepressed to repressed expression, F
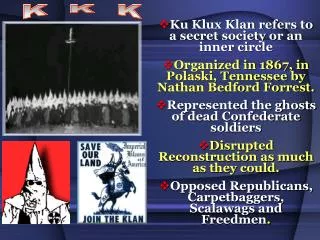
Why Some FFL are rarely selected? E.g. I1 and I4
1 0.5 0 -1 -0.5 0 0.5 1 1.5 2 2.5 1 0.5 0 -1 -0.5 0 0.5 1 1.5 2 2.5 1 0.5 0 -1 -0.5 0 0.5 1 1.5 2 2.5 Fig 4.13: The effect of input signal Sy on the dynamics of the I1-FFL. When Sy is absent, Y is not active as a repressor, and the concentration of protein Z shows an increase to a high unrepressed steady-state (dashed line) Sx Y Z Sy absent Sy present
I1-FFL X Y AND Z Fig 4.14: The incoherent type-1 FFL and type-4 FFL I4-FFL X Y AND Z
Kyz Time Fig 4.15: Dynamics of the I4-FFL following a step of Sx. In the presence of Sx, protein X is active and activates Z production but represses production of Y. When Y levels decay below the activation coefficient Kyz, the concentration of Z begins to drop. Production and decay rates are βZ=1, αz= αy=1,F=10. The signal Sy is present throughout.
Fi g 4.16: On the evolution of the FFLs. (a) The V-shaped pattern in which X and Y regulate Z is strongly selected because it allows regulation based on two inputs. The edge from X to Y (white arrow) must be selected based on the basis of an additional dynamical functions (e.g. sign sensitive delay, acceleration, pulse generation). (b) In many cases homologous genes Z and Z' in different organisms are regulated in a FFL in response to the same stimuli, but the two regulators X and Y in the FFL are not homologous to the regulators X' and Y'. Homology means sufficient similarity in the genes sequence to indicate that The genes have a common ancestor. (a) (b) X X Y Y non- homologous X’ X non- homologous Y Y’ Z Z Z Z ’ homologous
Fig 5.1 The single input module (SIM) network motif. Transcription factor X regulates a group of genes Z1,.. Zn, with no additional transcription factor inputs. X usually regulates it self. An example of a SIM, the argninine biosynthesis pathway (in this system, all regulations are repression).
Fig 5.2 A single-input module (SIM) regulating a three-step metabolic pathway. The master repressor R represses a group of genes that encode for enzymes, E1,E2 E3 (each on a different operon). These enzymes catalyze the conversion of substrate S0 to S1 to S2 culminating in the product S3. The product S3 binds to R, and increases the probability that R is in its active state R*, in which it binds the promoters to repress the production of enzymes. This closes a negative feedback loop, where high levels of S3 lead to a reduction in its rate of production. R Gene E2 Gene E3 Gene E1 E1 E2 E3 S0 S1 S2 S3 product
Fig 5.3 The SIM can generate temporal programs of expression. As the activity of X gradually rises, it crosses the different thresholds for each target promoter in a defined order. When X activity declines, it crosses the thresholds in reverse order (last-in-first out or LIFO order). Source: shen-orr nature genetics 2002
Zaslaver et al Nature genetics 2004 Fig 5.4 Temporal order in arginine biosynthesis system with minutes between genes. Colored bars show expression from the promoters of the different operons in the system, measured by means of a luminescent reporter gene. The position of each gene product in the pathways that produce arginine is shown.
Fig 5.6: Simple topological generalizations of the FFL. Each topological generalization corresponds to duplicating one of the nodes of the FFL and all of its edges. (a) The FFL, (b) generalizations based on duplicating one node ( c) multi-node generalizations. Source: Kashtan et al, PRE 2004.
Fig 5.7: The flagella motor of E. coli and its assembly steps Annual Review of MicrobiologyVol. 57: 77-100 (2003) (doi:10.1146/annurev.micro.57.030502.090832) HOW BACTERIA ASSEMBLE FLAGELLA Robert M. Macnab info.bio.cmu.edu/.../ FlagellaMotor.html www.aip.org/mgr/png/2002/174.htm
Fig 5.8: Schematic plan of the multi-output FFL that regulates the flagella motor genes. Shown are the logic gates at each promoter, and the activation thresholds. X=flhDC, Y=fliA, Z1=fliL, Z2=fliE etc. X Kxy K2 K1 Kn Y Kn’ K2’ K1’ OR OR OR Z2 Zn Z1
5.9: Temporal order in the flagella system of E. coli. Colored bars are the normalized expression of each promoter, where blue is low and red is high expression. Expression was measured by means of green fluorescent reporter gene. The temporal order matches the assembly order of the flagella, in which proteins are added going from the intra-cellular to the extra-cellular sides. Source: Kalir etal Science 2001
X K2 K1 K1 K2 Y K1’ K2’ K1’ K2’ Z1 Z2 K1<K2 K1’>K2’ time Fig 5.10: First-in First out order (FIFO) in the multi-Z FFL with OR-logic input functions. The output genes Z1 and Z2 are turned on when X crosses Activation thresholds K1 and K2 (dashed lines). The genes Are turned off when Y decays below activation thresholds K1’ and K2’. When the order of K1 and K2 is opposite to that of K1’ and K2’, FIFO order is obtained.
Fig 5.11: The 4-node network motifs in sensory transcription networks. X X1 X2 Y Z1 Z2 Z2 Z1 Two-output Feed-forward loop Bifan
The main five-node network motifs in the transcription network of E. coli. The bi-fan generalizes to larger patterns with a row of inputs and a row of outputs. Fig 5.12 bifan Two-output FFL 1 1 1 1 1 2 2 2 2 2 2 1 1 1 1 1 1 1 3 3 3 3 3 2 2 2 2 2 2 2
Fig 5.13 The Dense-overlapping regulons (DOR) network motif, and an example in the E. coli stress response and stationary phase system. Source: Shen-Orr, R Milo, S Mangan & U Alon, Nature Genetics, 31:64-68 (2002).
Fig 5.14 The global structure of part of the E. coli transcription network. Ellipses represent transcription factors that read the signals from the environment. Circles are output genes and operons. Rectangles are DORs. Triangles are outputs of single- or multi-output FFLs. Squares are outputs of SIMs. Blue and red lines correspond to activation and repression interactions.
Slows response time Possible bi-stability Chapter 3.5.1 X speeds response time, steady-state robust to fluctuations in production Chapter 3 X Fig 5.15 Network Motifs in sensory transcription networks Negative Auto-regulation Positive Auto-regulation X Coherent Feed-forward loop C1- FFL Sign-sensitive delay Filters out brief ON (OFF) input pulses when the Z-input function Is AND (OR) logic. Chapter 4.5-4.6 Y Z X Pulse generation Signs-sensitive Response acceleration Incoherent Feed-forward loop I1-FFL Chapter 4.7 Y Z
Fig 5.15 cont: Network Motifs in Sensory transcription networks X Coordinated control Temporal (LIFO) order of Promoter activity Chapter 5.3-4 Single- Input Module (SIM) Y1 Y2 . . . Yn X Acts as FFL for each input (sign-sensitive delay, etc) FIFO temporal order of promoter activity Multi-output Feed-forward loop (multi-output FFL) Chapter 5.5 Y Z1 Z2 Zn X1 X2 Bifan Combinatorial logic based on multiple inputs, depends on Input-function of each gene Chapter 5.6 Y1 Y2 X1 X2 Xn Dense overlapping Regulons) DOR( Y1 Y2 Ym
Double-negative feedback loop Double-positive feedback loop X Y X Y X Y X Y Z Z X Y Z X Y Z Steady-State 1 ON OFF OFF Steady-State 1 ON ON ON OFF ON ON Steady-State 2 OFF OFF OFF Steady-State 2 Fig 6.1 Positive transcriptional feedback loops with two nodes. The double positive loop has two activation interactions, and the double negative is made of two repression interactions. An output gene Z is regulated as shown. Each of the feedback loops has two steady states: both X and Y genes ON or OFF in the double-positive loop, and either ON in the double-negative loop.
a) X X Y Y b) X Y X Y X Y X Y X Y Z Z Z Z Z X Y X Y X Y X Y X Y Z Z Z Z Z Fig 6.2: a) Two-node feedback loops with auto-regulation are a common network motif In developmental transcription networks. b) The ten distinct types of regulating feedback motifs, each corresponding to a different combination of regulation signs.
b) Z a) Z X Y X Y Z* Z* X X memory memory Y Y time time 6.3 The regulated-feedback network motif in developmental transcription networks. (a) Double positive feedback loop. When Z is activated, X and Y begin to be produced They can remain locked ON even when Z is deactivated (at times after the dashed line). (b) Double negative feedback loop. Here Z acts to switch the steady states. Initially Y is high and represses X. After Z is activated, X is produced and Y is repressed. This state can persist even after Z is deactivated. Thus, in both a and b, the feedback Implements a memory.
b) a) X Y Z X Y Z X X Kxy Y Y Kyz Z Z Cell generations Cell generations Fig 6.4 Transcription cascades can generate delays on the order of the cell-generation time (in the case of stable proteins). Each step in the cascade activates or represses the next step when it crosses its threshold (dashed lines). Shown are a cascade of activators and a cascade of repressors.
X1 Z Z3 Z1 Z2 Y1 AND AND Z1 X2 time Y2 Fig 6.5: The transcription network guiding development of the B. subtilis spore.Z1, Z2 and Z3 represent groups of tens to hundreds of genes. This network is made of two type-1 incoherent FFLs, that generate pulses of Z1 and Z2, and two type-1 coherent FFLs, one of which generates a delayed step of Z3. Based on R. Losick, PLOS 2004 AND AND Z2 Z3
Ligand binds receptor activating the phosphorylation of kinase X X X-p v v Phosphatase 6.6 Protein kinase cascade: Ligand binds the receptor which leads, usually through adaptor proteins , to Phosphorylation of kinase X. Kinase X is active When phosphorylated, X-p. X-p phosphorylates kinase Y. Y-p, in turn, phosphorylates Z. The last kinase, Z-p, Phosphorylates transcription factor T, making it active, T*. T* enters the nucleus and activates (or represses) transcription of genes. Phoaphatases remove the phosphoryl groups (light arrows). v Y Y-p v Z v Z-p v v T T* v Transcription of genes
bifan diamond 1 1 1 1 1 1 2 2 2 2 2 2 2 2 3 3 3 3 3 3 6.7 Network motifs in signal-transduction networks. The main four-node motifs are the diamond and the bifan. The diamond has four nodes, and three different roles, labeled 1,2 and 3. Each generalization is obtained by duplicating one of the nodes and all of its edges. These generalizations are all also network motifs in signal transduction networks.