Download
1 / 24
240 likes | 335 Views
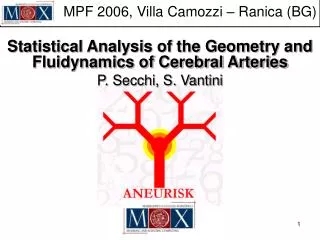
Explore the geometrical and fluid dynamic characteristics of cerebral arteries using statistical analysis. Preliminary conclusions suggest differences between high and low aneurysm patients. Future work includes more efficient estimates of eigenfunctions and discriminant-oriented analyses.

E N D
MPF 2006, Villa Camozzi – Ranica (BG) Statistical Analysis of the Geometry and Fluidynamics of Cerebral Arteries P. Secchi, S. Vantini
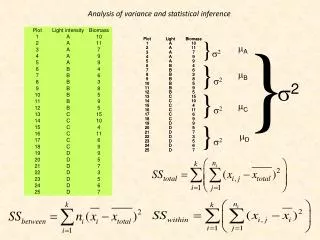
Variables Abscissa X Y Z Radius Curvature Torsion
Categorization H High Aneurysm 33 L Low Aneurysm 25 N No Aneurysm 7
Registration 1/3 We register by shift on Z’
Radius FPCA Equal variances P < 0.1% Equal means P = 1.2% Equal variances P < 0.1% Equal means P = 0.6% Equal variances P < 0.1% Equal means P = 83.4%
Curvature FPCA Equal variances P = 0.2% Equal means P = 76.3% Equal variances P = 3.6% Equal means P < 0.1% Equal variances P < 3.3% Equal means P = 38.0%
Preliminary Conclusions L patients seem to have: • Narrower carotid; • Less “necked” carotid; • More curved carotid; • More variability in terms of both Radius and Curvature. H patients seem to have: • Wider carotid; • More “necked” carotid; • Less curved carotid; • Less variability in terms of both Radius and Curvature. Most aneurysms along the carotid (83%) seem to be: • Located after the pick of curvature. Among these, many (44%) seem to be: • Concentrated in a small segment of the carotid (3.57mm long, with confidence 95%); • Centred just after the pick of Curvature (8 +/- 0.54mm after, with confidence 95%).
Work in Progress Multivariate Response Registration.(X’, Y’, Z’) Introduce More General Registration Functions.(monotonic) Multivariate Response FPCA.(Radius, Curvature, Torsion) Search for More Efficient Estimates of the Eigenfunctions(Penalty, Smoothing) Development of models that enable us to use the whole profiles. Development of more Discriminant Oriented Statistical Analyses. Test hypothesis through CFD simulations of selected cases.
References Castro P.E., Lawton W.H. and Sylvestre E.A. (1986)Principal Modes of Variation for Processes With Continuous Sample Curves, Technometrics, Vol. 28, No. 4, 329-337. Cleveland W.S., Grosse E. and Shyu W.M. (1992)Local regression models, Chapter 8 of Statistical Models in Seds Chambers J.M. and Hastie T.J., Wadsworth & Brooks/Cole. James G.M. and Silverman B.W. (2005) Functional Adaptive Model Estimation, Journal of the American Statistical Association, Vol. 100, No. 470, 565-575. James G.M. and Sugar C.A. (2003) Clustering for Sparsely Sampled Functional Data, Journal of the American Statistical Association, Vol. 98, No. 462, 397-408. Jones M.C. and Rice J.A. (1992)Displaying the Important Features of Large Collection of Similar Curves, The American Statistician, Vol. 46, No. 2, 139-145. Muller H.G. and Stadtmuller U. (2005)Generalized Functional Linear Models, The Annals of Statistics, Vol. 33, No. 2, 774-805. Ramsay J.O. and Silverman B.W. (2005)Functional Data Analysis, second edition, Springer New York NY. Serban N. and Wasserman L. (2005)CATS: Clustering After Transformation and Smoothing,Journal of the American Statistical Association, Vol. 100, No. 471, 990-999.