Download
1 / 51
510 likes | 596 Views
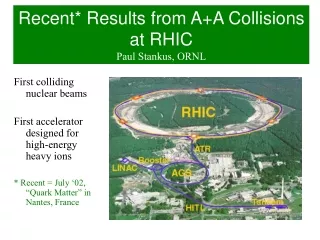
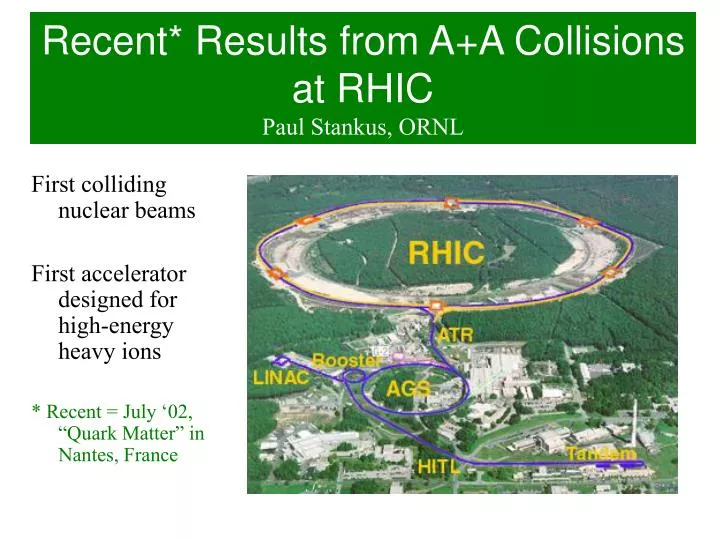
Recent* Results from A+A Collisions at RHIC Paul Stankus, ORNL. First colliding nuclear beams First accelerator designed for high-energy heavy ions * Recent = July ‘02, “Quark Matter” in Nantes, France. Goal. To persuade (some of) you that pQCD in A+A collisions

E N D
Recent* Results from A+A Collisions at RHICPaul Stankus, ORNL First colliding nuclear beams First accelerator designed for high-energy heavy ions * Recent = July ‘02, “Quark Matter” in Nantes, France
Goal To persuade (some of) you that pQCD in A+A collisions at RHIC could be a very rich and interesting field: Exotic initial state effects Exotic collision effects Exotic final state effects Many channels, processes and probes Dramatic data available now! with much more to follow
Exotic (p & non-p)QCD effects Initial State: High density of partons at low and modest x; Unusual shadowing?“Colored Glass Condensate”? Collision Overlap: Multiple scattering of partons; large kT smearing? Very high density of gluons; Classical color fields? Final State: Hard-scattered products exit through excited medium; Medium Effects? Is fragmentation modified?
p p Our Original Motivation We can measure a full palette of hard-scattering products: • To use hard scattering products as probes to measure the properties of dense, highly excited QCD matter (what you would call final-state-effects) • We originally conceived of hard-scattering products as “calibrated sources” created within HI collisions (we have since learned better!) q: fast color triplet Induced gluon radiation? g: fast color octet Q: slow color triplet Energy Loss? QQbar: slow color singlet/octet Dissociation? Virtual photon: colorless Controls Real photon: colorless Unknown Medium
Jet Prelude: Why is this hard? • Cannot look at “true”, traditional calorimetric jets; soft particle energy density dET/dhdf ~ 100 GeV/unit-radian • Next best thing: leading particles = high-PT hadrons, and also high-PT pairs, either same side (leading and next-leading) or opposite side (leading and opposite leading) • Ambiguity between hadrons from jet fragmentation source and hadrons from multi-collisional/”thermal” source, even out to several GeV/c (and beyond?) • Model “thermal” source: hadron gas with temperature, chemical (ie flavor) equilibration, baryon density and overall flow velocity in radial direction
description by hydrodynamical source perfect description possible Tch = 172 ± 2 MeV mB = 37 ± 4 MeV Tkin = 123 ± 6 MeV < bT >= 0.45 ± 0.02 Thermal Model can fit hadron spectra out to at least 4 GeV/c -- do you believe it? T.P., nucl-th/ 0207012 • spectra of pions and (anti)protons T. Peitzman
History of High-Energy A+A Beams • BNL-AGS: mid 80’s, early 90’s O+A, Si+A 15 AGeV/c s1/2NN ~ 6 GeV Au+A 11 AGeV/c s1/2NN ~ 5 GeV • CERN-SPS: mid 80’s, early 90’s O+A, S+A 200 AGeV/c s1/2NN ~ 20 GeV Pb+A 160 AGeV/c s1/2NN ~ 17 GeV • BNL-RHIC: early 00’s Au+Au s1/2NN ~ 130 GeV Au+Au, p+p s1/2NN ~ 200 GeV Finally: enough energy for copious hard scattering processes!
Nomenclature: Centrality Describe classes of events by percentile of impact parameter distribution: 40 mbarn Peripheral; 60%-80% <NCollisions> = 20 +- 5 Characterize A+A collision intuitively in Glauber model: Here NParticipant = 4 NCollision = 3 <NColl> = <TAB> sN+N inel Central; 0%-10% <NCollisions> = 850 +- 20
1 1 1 A+A hadrons Quantifying Nuclear Effects R R = seA(x,Q2)/A sep(x,Q2) General DIS x Shadowing, EMC, etc. RA RA = spA(PT)/A spp(PT) Hadron PT spectra Cronin effect PT a spA(xF) = Aaspp(xF) eg DY, J/Y xF Absorption, initial state energy loss ? (This space available!)
RHIC Year-1 High-PT Hadrons Charged and neutral hadron spectra out to pT~4-5 GeV/c Nominally expect production through hard scattering, scale spectra from N+N by number of binary collisions Peripheral reasonably well reproduced; but central significantly below binary scaling
Last Year’s Big News Observe: RHIC spectra fall below binary scaling at all pT for central events Previous highest energy A+A collisions exceed binary scaling (Cronin expectation) Suspect:scattered parton interaction in dense medium; but must keep an open mind
“The cover of the Rolling Stone” (Almost) No one reads PRL on paper these days. Cover artists thought the graph looked better without numbers on the axes. (We were pleased nonetheless.)
Preliminary sNN = 200 GeV Preliminary sNN = 200 GeV Charged Hadron Spectra T.Peitzman C. Jorgensen, BRAHMS Parallel Saturday 200 GeV results from all experiments J. Klay, STAR Parallel Saturday J. Jia, PHENIX Parallel Saturday C. Roland, PHOBOS Parallel Saturday
130 GeV nucl-ex/0206011 Preliminary sNN = 200 GeV Preliminary sNN = 200 GeV J.Klay RAA Comparison to pT = 6 GeV/c Similar Suppression in all centralities at 200 GeV
Preliminary sNN = 200 GeV 130 GeV • 200 GeV J.Klay Central/Peripheral Comparison At 130 GeV, the suppression increases up to pT = 6 GeV/c. 0.5 With higher pT data from 200 GeV, we see thatthe suppression has saturated at pT ~6 GeV/c 0.5
High pt suppression at 130 GeV J.Jia PHENIX (nucl-ex/0207010) 130GeV • Detailed pT and centrality dependence • Peripheral RAA 1 • Central RAA saturates ~ 0.6 at pt >2GeV/C Consistent with STAR(nucl-ex/0206011)
J.Jia Ratio central/peripheral colored bracket represent the systematic error. thick black line is uncertainty of the scaling factor from N. collisions • Lower ratio for 200 GeV • more suppression or change in proton yield? • Similar shape for 130 and 200 GeV • increase to 2 GeV/c • decrease to 4 GeV/c
Charged particle pT spectra from 200 GeV pT >2 GeV/c, decrease of inverse slope suppression h+ + h- J.Jia pT <2 GeV/c, increase of inverse slope flow
Comparison with NN references I Calculate RAA: divide data by NN references • RAA for central collisions • significantly below 1 • 200 GeV below 130 GeV data • ~ 0.2 ± 0.08 from 4 to 8 GeV/c • RAA for peripheral collisions • ~ 0.75 ± 0.3 for pT>2GeV/c • consistent with 1 • similar to 130 GeV J.Jia Shaded band is syst. error from NN Common syst. Scaling error
S.Mioduszewski PHENIX Overview • Most of central arms used to measure the pion spectrum • Powerful cross-checks of results
Comparison with UA1 Fitting PHENIX Preliminary H. Torii • UA1 data are only up to 6GeV/c and extrapolated to higher pT • The extrapolation is below our data at high pT Now have pp data to use as important reference for Au+Au collision and jet quenching measurement. UA1 data extrapolation pT dependent systematic error Normalization systematic error 30% is not included here.
Comparison with QCD Calculation PHENIX Preliminary • NLO pQCD calculation • CTEQ5M pdf • Potter-Kniehl-Kramer fragmentation function • = pT/2, pT, 2pT • Consistent with data within the scale dependence. H. Torii pT dependent systematic error Normalization systematic error 30% is not included here.
S.Mioduszewski Nuclear Modification Factor D. d’Enterria talk SPS – “Cronin” effect RHIC - suppression Our own measure of the p+p spectrum reduces the uncertainty! Effect of nuclear medium on yields PHENIX Preliminary binary scaling
Suppression in Inclusive Photons S.Mioduszewski Photons (primarily from 0 decays) also show suppression Not an artifact of extraction of 0 peak yield Klaus Reygers talk
Hadron Species Ratios in Run-1 (Anti)Baryon/pion ratios rise well above values in p+p Suspectradial hydrodynamical flow boosting baryons while mesons are suppressed;but Similar effect seen in p+A/p+p (Cronin); Could potentially be a modification to the fragmentation process
T.Sakaguchi pbar/ and p/ • pbar/ , p/ ratios • pT<2GeV, pbar/-, p/+ • pT>1GeV, use 0 with -, + • Point-by-Point Errors include point-by-point statistics+systematic errors • Bands: pT independent systematic errors • Decreasing at much more high pT? pbar/pi p/pi By Takao Sakaguchi at Quark Matter 2002, July 18-24 at Nantes, France
Comparison with Year-1 Data T.Sakaguchi • Data Compared to Year-1 • Both Year-1 and Year-2 are consistent within systematic errors • Another hint. • More rather than protons? By Takao Sakaguchi at Quark Matter 2002, July 18-24 at Nantes, France
Particle Composition at high pT 0/(h++h-)/2 ratio ~ 0.5 up to 9 GeV/c do protons continue to make up a large fraction of charged hadron yield? S.Mioduszewski
Interlude: “Elliptic Flow” The impact parameter vector defines the “reaction plane direction” in non-central collisions. Low PT particles “feel” this geometry and show a quadrupole distribution relative to the event plane direction. Event plane directions were first measured with recoiling beam fragments, but can also be derived from low-PTf distributions f b dN/df ~ 1 + 2 v2 cos(2f) -p +p
How to sense geometry Hard-scattered partons travel through early medium; modification? Identical pair correlations reveal space-time geometry High-Pt hadrons Br? Fragmentation Pressure gradients lead to collective motion Heavy flavor quark endures; Is there medium interaction? Thermal production? Difference in pressure gradients can lead to anisotropic motion
Comparison v2 (pT) with models (130 GeV) K.Filimonov Adler et al., nucl-ex/0206006 • qualitative agreement with “jet-quenching” scenario
K.Filimonov v2(pT) up to 12 GeV/c • Statistical errors only • Finite v2 up to 12 GeV/c in mid-peripheral bin
Sources of azimuthal correlations STAR Preliminary Au+Au @ 200 GeV/c 0-5% most central 4<pT(trig)<6 GeV/c 2<pT(assoc.)<pT(trig) • Au+Au • flow • p+p and Au+Au collisions: • dijets • momentum conservation • jets • resonances All Small D.Hardtke
Relative Charge Dependence STAR Preliminary @ 200 GeV/c 0-10% most central Au+Au p+p minimum bias 4<pT(trig)<6 GeV/c 2<pT(assoc.)<pT(trig) Strong dynamical charge correlations in jet fragmentation Compare ++ and -- charged azimuthal correlations to +- azimuthal correlations ||<0.5 - ||>0.5 (scaled) Au+Au 0<||<1.4 p+p Same particle production mechanism for pT>4 GeV/c in pp and central Au+Au D.Hardtke
PHENIX Preliminary PHENIX Preliminary PHENIX Preliminary 0.6-1 GeV 1- 2 GeV 2- 4 GeV 1/Ntrig dN/d PHENIX Preliminary PHENIX Preliminary PHENIX Preliminary 0.6-1 GeV 1- 2 GeV 2- 4 GeV 1/Ntrig dN/d Excess Above Flat Background, p-p • Data points (black) are background subtracted and acceptance corrected. • Blue is the PYTHIA curve * apythia * <> M.Chiu
Excess from Flat Bkg, Au-Au PHENIX Preliminary 2-4 GeV 0-10% Central 2-4 GeV 40-60% Central PHENIX Preliminary M.Chiu black = associated charged particles, green = mixed, purple = subtracted • In AuAu collisions there is a statistically significant excess from a flat distribution at all centralities and all pt bins. • So what is that excess? Try both PYTHIA only and also PYTHIA + elliptic flow contribution.
Fitting Pythia + 2vchvtrigcos(2),pt dependence M.Chiu 20-40% Cent PHENIX Preliminary PHENIX Preliminary PHENIX Preliminary PHENIX Preliminary 1/Ntrig dN/d 0.3-0.6 GeV 0.6-1 GeV 1- 2 GeV 2- 4 GeV vchvtrig apythia • For lower pt, ambiguity between the contribution from the elliptic flow component and the jet-like component. • At higher pt (2 GeV and above), the jet-like component dominates over any elliptic flow component.
Peripheral Au+Au data vs. pp+flow D.Hardtke
Central Au+Au data vs. pp+flow D.Hardtke
Ratio vs. # participants D.Hardtke
Npart Scaling at high pT C.Roland PHOBOS Preliminary Ncoll-scaling Normalized to yield at Npart = 65 • Npart scaling describes data at pT 4.25 GeV/c
y=2.2 Central/Semi-peripheral collision at y2 C.Jorgensen • Indicates suppression of high pTpions at y2. • Sets in at lower pT (compared to y=0)?
gconversion p0 gee h gee, 3p0 w ee, p0ee f ee, hee r ee h’ gee Separation of non-photonic e±: cocktail method PYTHIA direct g (J. Alam et al. PRC 63(2001)021901) R.Averbeck
PHENIX: PRL 88(2002)192303 NLO pQCD (M. Mangano et al., NPB405(1993)507) PHENIX PYTHIA ISR Energy dependence of charm production R.Averbeck
Centrality dependence at 200 GeV R.Averbeck
Same plots as previously but now on a linear scale. p-p ee Invariant Mass Spectrum A.Frawley All triggers This analysis NJ/Y = 24 + 6 (stat) + 4 (sys) Bds/dy = 52 + 13 (stat) + 18 (sys) nb
A.Frawley pp mm Invariant Mass Spectrum 1.2 < y < 1.7 NJ/Y = 26 + 6 + 2.6 (sys) B ds/dy = 49 + 22% + 29% (sys) nb 1.7 < y < 2.2 NJ/Y = 10 + 4 + 1.0(sys) B ds/dy = 23 + 37% + 29% (sys) nb
Gaussian and PYTHIA shape fits give essentially the same integral. The quoted result is the average of the two fits. A.Frawley s (pp->J/Y) = 3.8 + 0.6 (stat) + 1.3 (sys) mb * See J.F. Amundson et al., Phys. Lett. B 390 (1997) 323.
Au-Au ee Invariant Mass Spectra NJ/Y = 5.9 + 2.4 (stat) + 0.7 (sys) NJ/Y = 10.8 + 3.2 (stat) + 3.8 - 2.8 (sys) A.Frawley
Are our data consistent with binary scaling? A confidence level of 16% says that a truly flat distribution would produce a fit as poor as this in 16% of cases. So it probably trends down with increasing Npart, but don't bet the farm! A.Frawley