Download
1 / 15
150 likes | 548 Views
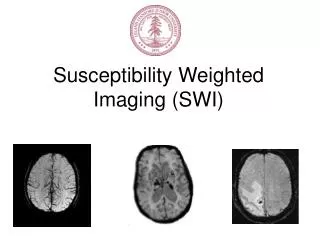
Contrast T1 weighted – (MPRAGE-anatomical) T2 weighted – (fmri). Spin Relaxation. Spins do not continue to precess forever Longitudinal magnetization returns to equilibrium due to spin-lattice interactions – T 1 decay

E N D
ContrastT1 weighted – (MPRAGE-anatomical)T2 weighted – (fmri)
Spin Relaxation • Spins do not continue to precess forever • Longitudinal magnetization returns to equilibrium due to spin-lattice interactions – T1 decay • Transverse magnetization is reduced due to both spin-lattice energy loss and local, random, spin dephasing – T2 decay • Additional dephasing is introduced by magnetic field inhomogeneities within a voxel – T2' decay. This can be reversible, unlike T2decay
MR Signal start end T1 Recovery Collective Magnetic Moment of Protons B0 T1 decay – “spins back down” signal we “hear” V Time Typical T1 Graph 1 s Time
T2 decay – separation (dephasing) of “collective magnetic moment” sometime after RF excitation Immediately after RF excitation collective magnectic moment individual spins a little time later = separation (dephasing) MR Signal T2 Decay Typical T2 Graph Time 50 ms
Spin Echo Y X
MR Signal MR Signal T2 Decay T1 Recovery Proton Density Contrast 1 s 50 ms TE – echo time TR – repeat time
MR Signal T1 Recovery T1 Contrast MR Signal T2 Decay 50 ms time 1 s time TE – echo time TR – repeat time
MR Signal MR Signal T2 Decay T1 Recovery T2* and T2 Contrast 1 s 50 ms TE – echo time TR – repeat time
Proton Density Weighted Image T1 Weighted Image T2 Weighted Image
Tissue T1 (ms) T2 (ms) Grey Matter (GM) 950 100 White Matter (WM) 600 80 Muscle 900 50 Cerebrospinal Fluid (CSF) 4500 2200 Fat 250 60 Blood 1200 100-200 Properties of Body Tissues MRI has high contrast for different tissue types!