Download
1 / 23
230 likes | 415 Views
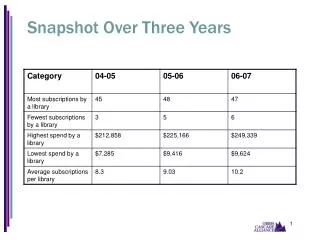
Three Years of AT Act Data FY2008 -- FY2009 -- FY2010. State Financing Activities (SFA). Three types: Financial Loans, Other - Provide AT, Other – Savings NOTE: Totals exceed 56 as some states report multiple State Financing programs. SFA Financial Loans. SFA Financial Loan Trends.

E N D
State Financing Activities (SFA) • Three types: • Financial Loans, Other - Provide AT, Other – Savings NOTE: Totals exceed 56 as some states report multiple State Financing programs.
SFA Financial Loan Trends Slight decline in number of states reporting Accounts for change in loans made, dollars loaned Few moved to comparability (most AFP reporting only) Section 4 programs somewhat unstable Mean Loan Amount slightly declining Mean Applicant Income relatively stable Running about 190% of poverty (family of 4) Mean Interest Rate consistent with prime decline Default – questionable data
Loan Types & Device Trends Shift to More Revolving Loans Far fewer guarantee and guarantee + buy down If 100% guarantee, revolving offers more control Vehicle Modification & Transportation Consistently majority of loans and dollars loaned Largest amount of loan per device Similar for AFP but even more of majority Hearing AT (hearing aids) Consistently second largest AT loans & dollars Same for AFP
SFA Other – Direct Provision of AT tty States eliminated Telework and individual funding assistance Telecommunications EDP accounts for hearing device numbers Home Modification Programs – environmental adapt value amounts Other data relatively stable
SFA Other – Cost Savings tty Very stable programs - cooperative buy, lease/rental, fabrication Majority Devices – Speech AT and Learning AT Majority Savings – Vision (average of $1,448 per device)
Reuse Basics tty
Reuse Trends Decline in states reporting Exchange - Increase in states reporting Refurbish & Open Loan Refurbish majority (close to 80%) of recipients, devices, savings Overall increase in recipients - plateau with FY2010 Overall increase in devices acquired – same plateau Fluctuation with exchange & open-ended loans Overall savings variable Due to open-ended loan and exchange fluctuation Refurbish/Reassign steady increase
Reuse Device Trends Exchange Majority Devices - Mobility, Daily Living Savings – Vehicle Modifications Refurbish/Reassignment Majority Devices - Mobility, Daily Living Savings - Mobility, Daily Living Open-Ended Loan Majority Devices - Mobility Savings - Mobility
Device Loan Trends Two additional states opted for flexibility in 2010. Overall number of device loans is level. Number of devices loaned is relatively stable. Decision-making is primary loan purpose. Accommodation purpose is becoming more clear. “Other” purpose for training of self or others. Borrower Types relatively stable. Individuals with Disabilities largest group, followed by Education, Health/Rehabilitation, and Family Members. AT Type Stable – Speech, Learning, Computers.
Device Demo Trends One additional state opted for flexibility in 2010. Overall number of demos is steadily increasing. Number of demo participants is also increasing. Referrals are increasing (and/or reporting is better). Consistent majority of referrals to vendors. Demo Participant Type relatively stable. Individuals with Disabilities largest group, followed by Family Members, Education, and Health/Rehabilitation. All AT Types well represented.
State Level Activity Summary tty SFA: smallest scope, fewest states - large ticket AT devices Reuse: large scope, all states – focused AT types Loan/Demo: largest scope, almost all states - all AT types
Consumer Satisfaction Overall satisfaction very high all three years. Overall response rate steadily increasing. Only about 3% less than “satisfied” all three years and less than 1% truly dissatisfied.
Training and I&A tty
CONTACT INFORMATION Diane Cordry Golden, Ph.D. Project Consultant National Information System for Assistive Technology 816.616.7668 dianegolden@sbcglobal.net NISAT is a project of the Association of Assistive Technology Act Programs (ATAP)