Download

1 / 20
200 likes | 340 Views
Forecast Challenges Associated with the Valentine’s Day, St. Patrick’s Day and Tax Day Nor’easters of 2007. Neil A. Stuart NWS Albany, NY NROW 9. Valentine’s Day Storm. Forecast guidance Anomalies Ensembles Plumes NCEP/HPC Observational data Forecast process and considerations

E N D
Forecast Challenges Associated with the Valentine’s Day, St. Patrick’s Day and Tax Day Nor’easters of 2007 Neil A. Stuart NWS Albany, NY NROW 9
Valentine’s Day Storm • Forecast guidance • Anomalies • Ensembles • Plumes • NCEP/HPC • Observational data • Forecast process and considerations • What happened
Anomalies and Plumes – 2 to 3 day lead time 3-4 SD below normal 3+ days in advance, increased to 4-5 SD closer to onset of storm } { Clustering between 1.5” and 2.4”
Ensemble probabilities for ≥1.00” liquid equivalent Widespread region of ≥ 90% probability of ≥ 1.00” of liquid equivalent Unusual consistency in the spread
Other guidance and observations HPC WWD forecasts temporal consistency with axis of heaviest snow Wind profile at boundary layer suggested warming and period of mixed precipitation at Albany Verified with 1800 UTC observed sounding
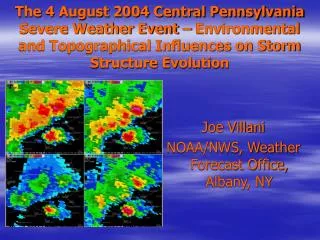
What Happened? Surface low track across southeastern New England, analog to some of the biggest snows in upstate NY Band of snow produced 4”-6” per hour • Widespread 20-42” of snow Capital Region of NY and north and west • NESIS Category 3 – ranked near Blizzard of ’78 in SE New England • I-80 shut down in PA due to accidents in mixed precipitation • Many planes stranded on runways for hours at JFK airport • 35 deaths
St. Patrick’s Day Storm • Forecast guidance • Anomalies • Ensembles • Plumes • NCEP/HPC • Observational data • What happened
Anomalies 3-4 SD below normal Only 1-2 SD below normal in U direction, but 3-5 SD above normal in V direction, with NE U.S. in RRQ
Anomalies Deterministic operational GFS and NAM show 4-5 SD below normal – not dampened by 15+ ensemble members Deterministic and ensemble upper level wind anomalies barely 2 SD below normal
Ensemble probabilities of 1.00” of liquid equivalent and plume guidance Widespread region of ≥ 90% probability of ≥ 1.00” of liquid equivalent, however, note western edge Most clustering between 1.0” and 2.5” { }
Other guidance and observations HPC WWD consistently kept the axis of heaviest snow in the Catskills and northern New England Extremely tight 850 hPa thermal gradient across southern NY and New England Extremely tight boundary layer thermal gradient contributed to very strong frontogenesis
What Happened? Surface low tracked across southeastern New England, similar to Valentine’s Day Storm Primary heavy snow band in Catskills, note much less reflectivity than Valentine’s Day Storm • 18-30” of snow in the Catskills with a foot or more over much of interior New England and New York • NESIS Category 2 • 10 deaths – all due to traffic accidents
Tax Day/Patriots Day Storm • Forecast guidance • Anomalies • Ensembles • Plumes • Observational data • What happened
Anomalies – Forecasted U wind anomalies at 850 hPa forecasted to be 3-5 SD below normal V wind anomalies at 850 hPa forecasted to be 3-4 SD above normal U wind anomalies at 250 hPa 2-3 SD below normal MSLP anomalies of 4-5 SD below normal
Anomalies – Observed U and V wind anomalies at 850 hPa U > 5 SD below normal U wind anomalies at 250 hPa between 3 and 4 SD below normal MSLP anomalies > 5 SD below normal
Ensemble probabilities of 2.00” of liquid equivalent and plume guidance Ensemble probabilities of ≥ 2.00” of liquid equivalent were > 50%, with MREF the highest and most widespread SREF shows more spread, but both ensembles show virtually all members supporting ≥ 2.00” of liquid equivalent } { Clustering of plumes between 1.5” and 3.5” of liquid equivalent
Other observations – What Happened Nearly isothermal at Albany, NY - Winds ≥ 50 KT above the surface Strong warm advection and deep winds ≥ 50 KT Strong deep southeast winds ≥ 50 KT • Widespread flooding in southern NY and the mid-Atlantic states • Severe coastal flooding and erosion from NJ through southern and eastern New England • 50 MPH wind gusts along the mid-Atlantic and New England coasts • 50 MPH or greater winds in the higher elevations of VT causing widespread tree and property damage • IRS allowed 2 more days to file tax returns • 156 MPH gust at Mt. Washington • Worst Weather in history of Boston Marathon • $180 million damages in NJ, second only to Hurricane Floyd
Lessons from all three storms • Ensemble guidance and derived products are revolutionizing forecasting • New tools and products are allowing for unprecedented lead times for warning of high impact events • POD ≥ 90%, FAR ≤ 20%, lead time for Watches ≥ 48 hours, Warnings ≥ 24 hours • Anomalies showing departures from normal distinguishes high vs. low potential storm impact in extended ranges (2+ days prior to onset) • Recognizing signals in ensemble means and spreads, and in anomaly displays helps quantify forecaster confidence • Ensemble means and spreads help quantify uncertainty and temporal trends/consistency from run to run • Probabilities for liquid equivalent rainfall amounts quantify confidence levels for corresponding snow amounts
Lessons from all three storms • Plume diagrams depict • A range of liquid equivalent rainfall amounts • Precipitation types • Mean and maximum amounts of each precipitation type • Clustering near certain values and precipitation types helps quantify confidence in those values • Despite advances in data analysis, assimilation and visualization, some important user groups are not benefiting • PA interstate closed due to multiple accidents • Jets stranded on runways for 10+ hours in NYC • 67 deaths attributed to all three storms • How can meteorologists help users to reduce the societal impacts of major winter storms like the 2007 storms? • Need to communicate forecast information in a manner understood by the most user groups • Need to educate users on how to best use current forecast products and services • Need to coordinate with users to best tailor current and future products for their needs
Improving predictions and communication = Better preparation for weather-related hazards = Reduced societal impacts!Thank you for your attention! • Real-time ensembles, anomalies, plumes and probabilities can be found at: http://eyewall.met.psu.edu Questions? http://www.sip.ucar.edu/wasis