Download
1 / 37
390 likes | 570 Views
Chapter 2: Population Geography. Where is the world’s population distributed? The Big 3 population cores/clusters What they have in common Ecumene /non- ecumene Where is the population increasing rapidly? Decreasing? Stagnant? What accounts for the differences? CBR, CDR, RNI, TFR

E N D
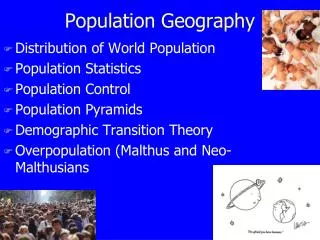
Chapter 2: Population Geography • Where is the world’s population distributed? • The Big 3 population cores/clusters • What they have in common • Ecumene/non-ecumene • Where is the population increasing rapidly? Decreasing? Stagnant? • What accounts for the differences? • CBR, CDR, RNI, TFR • Demographic transition theory/model of human societies.
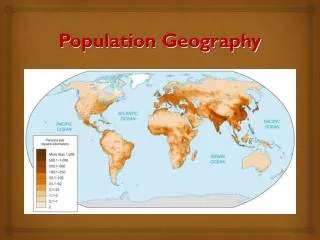
Population Distribution • Asia 3.7 Billion 61% • Africa 818 Million 13% • Europe 727 Million 12% • Latin Amer. 525 Million 8.5% • North Amer. 316 Million 5% • Au/NZ 31 Million .5%
The • ECUMENE – • Neolithic revolution
Population cores/clusters Ranked • 1. Megaloplis 55 M (Boston, Hartford, NYC, Philadelphia, Baltimore, DC, Richmond) • 2. (southern) Great Lakes 41 M (Milwaukee, Chicago, Detroit, Indianapolis, Columbus, Cleveland, Pittsburgh) • 3. SoCal 23 M (Los Angeles, San Diego) • 4. Piedmont 19 M (Raleigh-Durham, Charlotte, Atlanta, Birmingham) • 5. Florida Peninsula 15 M (Orlando, Tampa-St. Pete, Miami-Ft. Lauderdale, Jacksonville)
Different types of population density • Crude density (arithmetic density) = total population divided by land area • Nutritional density (physiological) = total population divided by amount of land under cultivation do you suppose that the USA’s “nutritional density” is higher or lower than China’s?
(Crude) Birth Rates: births per 1000 people per year (also referred to as “fertility” rates)
(Crude) Birth Rates: births per 1000 people per year (also referred to as “fertility” rates)
(Crude) Death Rate: deaths per 1000 per year (also referred to as “mortality” rates)
Rate of Natural Increase (births minus deaths) • CBR-CDR, then divide by 10 (to get percent); so…. • If CBR = 20, and CDR = 5, then the rate of natural increase = 15(/10)=1.5% per year
Representative exam questions • 1. Which of the following areas is NOT within the ecumene? • A. Northern Canada • B. The eastern USA • C. The Saharan desert • D. Both A and B • E. Both A and C
2. Which of the following is NOT true? • A. RNI is correlated to HDI • B. The CBR is inversely related to HDI • C. RNI is positively related to HDI • D. RNI is inversely related to HDI • E. Life expectancy is positively related to HDI
3. Which of the following is a formal region? • A. The network of Midwest airlines • B. UWW commuter shed • C. The “soda belt” of eastern Wisconsin • D. Both a and b are formal regions • E. Both b and C are formal regions
(Crude) Birth Rates: births per 1000 people per year (also referred to as “fertility” rates)
Dependency Ratio • Divide a society into 0-14, 15 -64, 65 and over. • The DR = dependent (0-14 + >65):productive (15-65) • Ideally the ratio should be 1:2, but in stage 2 (and/or 3) of the demo trans, it can be 1:1 • Also, if the CBR falls too low, the DR can also increase towards 1:1