Download
1 / 46
460 likes | 593 Views
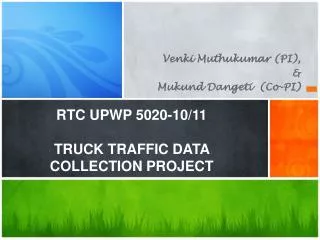
Venki Muthukumar (PI), & Mukund Dangeti (Co-PI ). RTC UPWP 5020-10/11 TRUCK TRAFFIC DATA COLLECTION PROJECT. Project Details. Project Personnel. Project Manager Dr Beth Xie, RTC Project Principle Investigator Dr Venki Muthukumar Project Co-Principle Investigator Dr Mukund Dangeti

E N D
Venki Muthukumar (PI), & Mukund Dangeti (Co-PI) RTC UPWP 5020-10/11TRUCK TRAFFIC DATA COLLECTION PROJECT
Project Personnel • Project Manager • Dr Beth Xie, RTC • Project Principle Investigator • Dr Venki Muthukumar • Project Co-Principle Investigator • Dr Mukund Dangeti • Project Staff and Students • Sarah Susmitha (VMS), Akshat Pampanwar (MySQL+JS), UdayBhaskarSatyavolu (FMS), Varun Bandarupalli (VMS), Jaya Suseela (FMS).
Project Budget • Total Cost of the Project: $62,500 (RTC) + $13,000 (UTC) • Other Cost: $24,000 (UNLV ECE – GA Support) • Project Duration: Aug 2009 – July 2010. • Project Approved: June 2009 • Project Start Date (PI/Co-PI): Aug 2009 • Project Start Date (RTC/UNLV): Jan 2010 • Project End Date: July 2010.
Main Objectives • The main objectives of the proposed project include: • An accurate evaluation of current volume of freight movement by trucks on major roadway routes in and around the Las Vegas valley. • Determine minimum, maximum and average truck counts by roadway segments, time, days and months. • Determine average speed of the trucks by roadway segments, lane, time, day and month. • Raw data delivery and CSV format data for modeling freight movements and facility planning. • Comprehensive report of the work conducted
Initial Research Methodology • Use video based data collection to determine freight traffic in the Las Vegas Valley. • Use Transresearch Data and Traffic Analysis Zones to identify location for video based data collection. • Use Autoscope or Iteris video based data collection tools to determine the freight / Truck count, speed and other traffic parameters.
Identify Location based on … • Explored Transresearch Data and TAZ data • Explored Freeway Management System (FMS) data provided by FAST. • FMS data is the data collected by a series of microware sensors in the Las Vegas Valley. • Currently these sensors monitor traffic along (I-15, US-95 and I-515) • Monitor vehicle counts, vehicle class and average speed and volume.
FAST FMS Data • TIMESTAMP, • PATH, • ROADINDEX, • ROADWAYID, • SEGMENTID, • LANE, • DEVICEID, • VOLUME, • VOLUME 1-6, • Etc.
DeviceID File DEVICEID, Latitude, Longitude, Direction, Description. FMS Data File TIMESTAMP, PATH, ROADINDEX, ROADWAYID, SEGMENTID, LANE, DEVICEID, VOLUME, VOLUME 1-6, etc. Device Vol File DEVICEID, Volume Set FMS Data Structure 1 36.067902 -115.2046 I-215 EB Decatur On-Ramp 2 36.0686 -115.2044 I-215 WB Decatur R-OFF 3 36.068298 -115.1954 I-215 WB CCTV128 1,I-215,EB Decatur On-Ramp,0,10 1,I-215,EB Decatur On-Ramp,1,30 1,I-215,EB Decatur On-Ramp,2,40 1,I-215,EB Decatur On-Ramp,3,42 1,I-215,EB Decatur On-Ramp,4,43 1,I-215,EB Decatur On-Ramp,5,83 20080502112043, 134, 0, 49, 2, 2, 12, 545, 405, 34, 16, 14, 20, 38, 12, 58, 40, 0, Freeway, I-15 NB NB near I-15 NB NB and I-15 NB NB, 30 20080502112043, 134, 0, 49, 2, 3, 12, 600, 279, 141, 70, 20, 21, 52, 14, 65, 40, 0, Freeway, I-15 NB NB near I-15 NB NB and I-15 NB NB, 30
FMS Data File DeviceID File Device VOL File C++ Scripts FMS Data Extraction Extracted for all PATHs unique RoadwayIDs, DeviceIDs and corresponding Total Volumes (VOL) and Truck Volumes (TKVOL) 20080502,134,49,12,99160,5235 20080502,25,50,12,7708,219 20080502,134,49,15,58668,2498 20080502,132,69,16,47282,1637 20080502,134,59,18,50636,2069 20080502,131,179,75,48551,1224 20080502,108,180,75,16450,0***
Plot of total volume for path-roadwayID-DeviceID (1-2-1) for the month 2008-05. Plotting of Extraction Data Plot of truck volume (>=50 ft) for path-roadwayID-DeviceID (1-2-1) for the month 2008-05.
Extracted Volume Analysis of Extracted Data DeviceID sorted by location in the PATH (99) Analysis by: Correlation Regresstion T-test Method (t-pair test method) Comparison with Estimated Volume. FIND CRITICAL DEVICES -> CRITICAL ROADWAYIDs -> CAMERA LOCATIONS
Video Data Collection Video file deleted due to larger file
Video based data collection Raw data from Autoscope Image Sensing Systems, Inc. Data Collector File, Version 9.3.0 4/17/2009 12:06:58 PM Detector ID List; 102;104;106;108;110;112;101;103;105;107;109; (Count and Presence Detector) 111;113;114;115;116;117;118; (Speed Detectors) 3;4;5;6;8;11;12;13;15;16;17;18;19;20;21; Detector Title;Date;Time;Duration;DataInterval;Speed;Length;Class;Volume;Arithmetic Mean Speed;Class A Count;Class B Count;Class C Count;Class D Count;Class E Count; 113_L6_1;3/27/2010;2:50:00 PM;;5 Minutes;;;;1;29.000;0;0;0;1;0; 114_L5_1;3/27/2010;2:50:00 PM;;5 Minutes;;;;8;27.500;3;4;1;0;0; 115_L4_1;3/27/2010;2:50:00 PM;;5 Minutes;;;;3;28.332;2;0;0;0;0; 116_L3_1;3/27/2010;2:50:00 PM;;5 Minutes;;;;6;23.500;3;3;0;0;0; 117_L2_1;3/27/2010;2:50:00 PM;;5 Minutes;;;;4;29.250;1;2;0;1;0; 119_L1_1;3/27/2010;2:50:00 PM;;5 Minutes;;;;2;31.500;0;2;0;0;0; 113_L6_1;3/27/2010;2:55:00 PM;00:05:00;5 Minutes;;;;50;37.477;22;17;8;0;0; 114_L5_1;3/27/2010;2:55:00 PM;00:05:00;5 Minutes;;;;99;28.766;32;36;24;4;0; 115_L4_1;3/27/2010;2:55:00 PM;00:05:00;5 Minutes;;;;120;30.805;35;38;40;6;0; 116_L3_1;3/27/2010;2:55:00 PM;00:05:00;5 Minutes;;;;115;28.598;22;48;35;6;0; 117_L2_1;3/27/2010;2:55:00 PM;00:05:00;5 Minutes;;;;115;27.121;25;50;35;3;0; 119_L1_1;3/27/2010;2:55:00 PM;00:05:00;5 Minutes;;;;30;31.164;3;18;7;2;0; 113_L6_1;3/27/2010;3:00:00 PM;00:05:00;5 Minutes;;;;35;38.512;9;14;11;1;0; 114_L5_1;3/27/2010;3:00:00 PM;00:05:00;5 Minutes;;;;94;31.156;30;31;24;4;0; 115_L4_1;3/27/2010;3:00:00 PM;00:05:00;5 Minutes;;;;111;31.078;32;32;38;8;0; 116_L3_1;3/27/2010;3:00:00 PM;00:05:00;5 Minutes;;;;112;29.543;21;49;37;4;0; 117_L2_1;3/27/2010;3:00:00 PM;00:05:00;5 Minutes;;;;109;28.621;16;48;35;8;0; 119_L1_1;3/27/2010;3:00:00 PM;00:05:00;5 Minutes;;;;44;31.930;3;18;15;5;0; 113_L6_1;3/27/2010;3:05:00 PM;00:05:00;5 Minutes;;;;36;38.609;9;13;10;2;0;
Validation of video based data collection • Work on fine tuning the counts and classification of vehicles was required.
VMS Data CAM125_20100615_1135AM_4_4HRS Class A:<20, ClassB:<30, ClassC:<60, ClassD:<90,ClassE: >90 CAMID, SensorID, LaneID, Date, Time, Status, Duration, , , Volume, ClassA,…. 125,109,1,6152010,113800,100,1,0,0,18,0,18,0,0,0 125,110,2,6152010,113800,100,1,0,0,21,1,16,3,1,0 125,111,3,6152010,113800,100,1,0,0,28,1,25,1,1,0 125,112,4,6152010,113800,100,1,0,0,8,0,7,1,0,0 125,117,1,6152010,113800,100,1,0,0,20,0,0,0,0,0 125,118,2,6152010,113800,100,1,0,0,21,0,0,0,0,0 125,119,3,6152010,113800,100,1,0,0,29,0,0,0,0,0 125,120,4,6152010,113800,100,1,0,0,9,0,0,0,0,0 125,109,1,6152010,113900,100,1,0,0,24,2,20,2,0,0 125,110,2,6152010,113900,100,1,0,0,23,2,18,1,2,0 125,111,3,6152010,113900,100,1,0,0,31,1,26,2,1,0 125,112,4,6152010,113900,100,1,0,0,4,0,4,0,0,0
UPWP Database Design for Data Collection Develop a MySQL database that will hold both FMS (FAST) data and Video based traffic data collected. Provide user graphical interface to run successful queries and analysis. Provide web and standalone interfaces to run successful queries and analysis.
UPWP Database Design Cmd line only
UPWP MYSQL DATABASE Upload CSV files from FMS or VMS data extracted files (pre-processing required)
FMS Query Window Load KML file to see location of sensors
Extracted Data from FMS I-15 : 132 – South Bound Path & 134 – North Bound Path US-95: 133 – South Bound Path & 106 – North Bound Path I-515: 99 – South Bound Path & 131 – North Bound Path
Extracted Data from FMS I-15 : 132 – South Bound Path & 134 – North Bound Path US-95: 133 – South Bound Path & 106 – North Bound Path I-515: 99 – South Bound Path & 131 – North Bound Path
Extracted Data from FMS I-15 : 132 – South Bound Path & 134 – North Bound Path US-95: 133 – South Bound Path & 106 – North Bound Path I-515: 99 – South Bound Path & 131 – North Bound Path
Analysis of Data Extracted from Query Truck (>50ft) Traffic Total Traffic
Compare 2008/2009 All Traffic vs Truck Traffic (total) Truck Traffic All Traffic
Compare 2008/2009 All Traffic vs Truck Traffic (Avg. volume/month) Truck Traffic All Traffic
VMS Data Collection Class A:<20, ClassB:<30, ClassC:<60, ClassD:<90,ClassE: >90
FMS – VMS Data Compared VMS Data for 6/15/2010 – 5hrs (~11 AM - ~ 4 PM) FMS Data for 6/15/2010 – 24hrs (12 AM – 12 PM) FMS Data for 6/15/2010 – 5hrs (12 AM – 5 PM)
Issues with FMS LANE IDs TIME FMS data collection is erratic Loss of FMS data from sensors is common Lack of comprehensive data
Issues with VMS • Extended VMS data collection not possible • Constant movement of cameras by NHP. • Same Camera used to collect data in both directions • Count detection is reliable • Classification is not reliable due to the position of the camera and the road topology
Conclusions • Developed a data fusion system to extract all vehicle volumes and truck/freight volumes from FMS data and VMS data. • System can extract count, volume and average speed of all vehicles and trucks.
Future Research • More comprehensive VMS data collection is required. • VMS data collection on non-FMS data collection paths can be pursued • Permanent VMS data collection stations can be installed. • Professional data extraction system need to be developed.
Thanks to … • Beth Xie – Project Manager RTC • Gang Xie – FAST • Jerry Duke – RTC • Students: • Sarah Susmitha (VMS), Akshat Pampanwar (MySQL+JS), UdayBhaskarSatyavolu (FMS), Varun Bandarupalli (VMS), Jaya Suseela (FMS). • Some students were partially supported by the UTC and ECE GA funds.
Thank You Questions?