Download
1 / 21
220 likes | 360 Views
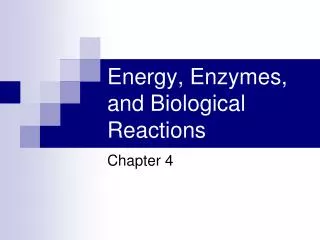
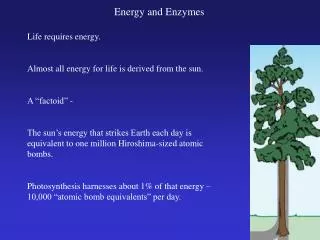
Energy and Enzymes. 10/17/08. Potential vs. Kinetic Energy. potential. kinetic. Fig. 8-13. Higher potential energy. Sucrose (C 12 H 22 O 11 ). Chemical Energy = Potential Energy available for release in a chemical reaction. Sucrase. Lower potential energy. Glucose (C 6 H 12 O 6 ).

E N D
Energy and Enzymes 10/17/08
Potential vs. Kinetic Energy potential kinetic
Fig. 8-13 Higher potential energy Sucrose (C12H22O11) Chemical Energy = Potential Energy available for release in a chemical reaction Sucrase Lower potential energy Glucose (C6H12O6) Fructose (C6H12O6)
Fig. 8-15 Course of reaction without enzyme EA without enzyme EAwith enzyme is lower Reactants Free energy Course of reaction with enzyme ∆G is unaffected by enzyme Products Progress of the reaction
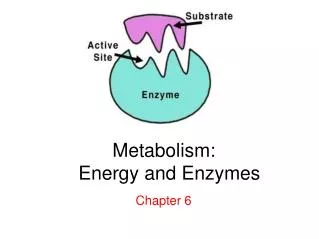
Fig. 8-16 Substrate Active site Enzyme Enzyme-substrate complex (a) (b)
Fig. 8-17 1 • The active site can lower an EA barrier by • Orienting substrates correctly • Straining substrate bonds • Providing a favorable microenvironment • Covalently bonding to the substrate Substrates Enzyme-substrate complex Enzyme Products
Enzyme activity can be affected by other factors • Environmental factors • Temperature • pH
Fig. 8-18 Optimal temperature for typical human enzyme Optimal temperature for enzyme of thermophilic (heat-tolerant) bacteria Rate of reaction 40 0 60 100 20 80 Temperature (ºC) (a) Optimal temperature for two enzymes Optimal pH for trypsin (intestinal enzyme) Optimal pH for pepsin (stomach enzyme) Rate of reaction 4 5 6 7 8 9 10 0 1 2 3 pH (b) Optimal pH for two enzymes
Enzyme activity can be affected by other factors • Environmental factors • Temperature • pH • Cofactors • Inorganic or organic (coenzyme) • Some vitamins are coenzymes • Inhibitors
Fig. 8-19 Inhibitors Substrate Active site Competitive inhibitor Enzyme Noncompetitive inhibitor (c) Noncompetitive inhibition (b) Competitive inhibition (a) Normal binding Ex. Ritonavir (protease inhibitor) competes for the active site of the HIV protease Ex. Sarin gas binds irreversibly to serine in the active site of acetylcholinesterase
Enzyme regulation • Controlling enzyme gene expression • Localization of enzymes within the cell • Allosteric regulation
Fig. 8-20 Active site (one of four) Allosteric enyzme with four subunits Allosteric regulation Regulatory site (one of four) Activator Active form Stabilized active form Oscillation Non- functional active site Inhibitor Inactive form Stabilized inactive form (a) Allosteric activators and inhibitors Substrate Stabilized active form Inactive form (b) Cooperativity: another type of allosteric activation
Enzyme regulation • Controlling enzyme gene expression • Localization of enzymes within the cell • Allosteric regulation • Feedback inhibition
Fig. 8-22 Initial substrate (threonine) Feedback inhibition Active site available Threonine in active site Enzyme 1 (threonine deaminase) Isoleucine used up by cell Intermediate A Feedback inhibition Enzyme 2 Active site of enzyme 1 no longer binds threonine; pathway is switched off. Intermediate B Enzyme 3 Intermediate C Isoleucine binds to allosteric site Enzyme 4 Intermediate D Enzyme 5 End product (isoleucine)
Enzyme regulation • Controlling enzyme gene expression • Localization of enzymes within the cell • Allosteric regulation • Feedback inhibition • Covalent modifications
Covalent Modifications Example: activation by phosphorylation in a MAP kinase cascade
Fig. 8-15 Course of reaction without enzyme EA without enzyme EAwith enzyme is lower Reactants Free energy Course of reaction with enzyme ∆G is unaffected by enzyme Products Progress of the reaction
Fig. 8-6 Reactants Amount of energy released (∆G < 0) Exergonic Reaction spontaneous Energy Free energy Products Progress of the reaction (a) Exergonic reaction: energy released Products Amount of energy required (∆G > 0) Endergonic Reaction Not spontaneous Energy Free energy Reactants Progress of the reaction (b) Endergonic reaction: energy required
Fig. 8-8 ATP is the energy source for cells Adenine Phosphate groups Ribose
Fig. 8-9 P P P ATP hydrolysis (exergonic) can be coupled to endergonic reactions to make the overall reaction exergonic Adenosine triphosphate (ATP) H2O + P P P Energy + i Inorganic phosphate Adenosine diphosphate (ADP)
Fig. 8-11 Membrane protein P P i Solute transported Solute (a) Transport work: ATP phosphorylates transport proteins ADP + ATP P i Vesicle Cytoskeletal track ATP c. Chemical work: driving endergonic reactions Protein moved Motor protein (b) Mechanical work: ATP binds noncovalently to motor proteins, then is hydrolyzed