Download
1 / 10
100 likes | 193 Views
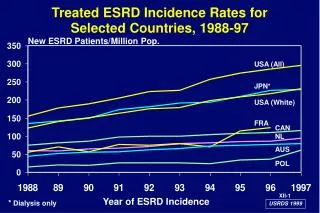
Explore ESRD incidence rates, diabetic nephropathy trends, and treatment modalities across select countries from 1986 to 1996. Analyze utilization of dialysis, transplantation rates, and patient demographics.

E N D
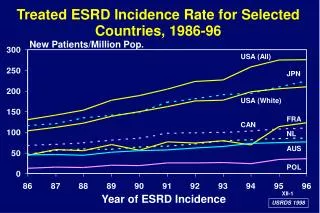
Treated ESRD Incidence Rate for Selected Countries, 1986-96 New Patients/Million Pop. USA (All) JPN USA (White) FRA CAN NL AUS POL Year of ESRD Incidence
Percent of Incident ESRD Patients with Diabetic Nephropathy for Selected Countries, 1996 % of ESRD Patients * * Country * Data are from 1995
Percent of Prevalent Dialysis Patients ReceivingHome Hemodialysis for Selected Countries, 1996 % of Dialysis Patients * * Country * Data are from 1995
Percent of Prevalent Dialysis Patients ReceivingCAPD or CCPD for Selected Countries, 1996 % of Dialysis Patients * Country * Data are from 1995
Utilization of CAPD/CCPD for Selected Countries, 1991 versus 1996 % of Dialysis Patients Receiving CAPD/CCPD * * * Country * Data are for 1990 versus 1995
Utilization of Home Hemodialysis for Selected Countries, 1991 versus 1996 % of Dialysis Patients Receiving Home Hemodialysis * * Country * Data are for 1990 versus 1995
Transplantation Rates for SelectedCountries, 1996 New Transplants/Million Pop. * * Country * Data are from 1995
Percent of Prevalent ESRD Patients with a Functioning Transplant, 1996 % of ESRD Patients * * Country * Data are from 1995
Patients with a Functioning Transplant per Million Population, 1996 Functioning Transplants/ Million Pop. * * Country * Data are from 1995
Utilization of Transplantation for Selected Countries, 1992 versus 1996 New transplants/ Year/ Million pop. * Country * Data are from 1993 versus 1996