CHAPTER 6: Integrated Operations Planning
CHAPTER 6: Integrated Operations Planning. McGraw-Hill/Irwin. Overview of integrated operations planning. Supply chain planning Supply chain planning applications Sales and operations planning APS system overview Collaborative planning, forecasting and replenishment Forecasting .

CHAPTER 6: Integrated Operations Planning
E N D
Presentation Transcript
CHAPTER 6: Integrated Operations Planning McGraw-Hill/Irwin
Overview of integrated operations planning • Supply chain planning • Supply chain planning applications • Sales and operations planning • APS system overview • Collaborative planning, forecasting and replenishment • Forecasting
Supply chain planning requires coordination of key processes • Demand planning responsiveness • Customer relationship collaboration • Order fulfillment/service delivery • Manufacturing customization • Supplier relationship collaboration • Life-cycle support • Reverse logistics
Factors that drive effective planning • Supply chain visibility is the ability to track inventory and resources • Information about available resources is effectively evaluated and managed • Requires exception management of potential problems as they are identified
Factors that drive effective planning • Simultaneous resource consideration is the ability to include demand, capacity, material requirements, and constraints in defining alternatives • Enables identification of trade-offs that can increase functional costs, but lower total system costs
Factors that drive effective planning • Resource utilization is a coordinated approach to making functional resource trade-offs • Considers service requirements while minimizing combined supply chain resources • Critical capability when firms emphasize overall asset utilization
Supply chain planning applications overview • Common software applications for most planning environments include • Demand planning • Production planning • Logistics planning • These applications can be sourced from the following options • Custom developed for the organization • Packaged solutions contained in a larger supply chain management system • Modules within an ERP system
Demand planning • Demand management system is the information technology component of the sales and operations planning (S&OP) process • Demand management develops the forecasts used by other supply chain processes to anticipate sales levels • Demand management processes must integrate • Historical forecasts • Promotional plans • Pricing changes • New product introductions • Forecasts are then used to determine production and inventory requirements • Must maintain forecast data consistency across multiple products and warehouse facilities
Productionplanning • Production planning uses requirements from demand management to develop a realistic manufacturing plan • Must integrate with manufacturing resources and constraints • Requirements plan defines what items are needed and when • Production planning systems match the requirements plan with the production constraints • Limitations include facility, equipment and labor availability • Effective planning creates a time-sequenced plan to manufacture the correct items in a timely manner while operating within constraints
Logistics planning • Logistics planning integrates overall movement demand, vehicle availability, and relevant movement cost into a decision support system that seeks to minimize overall freight expense • Analysis suggests ways freight can be shifted among carriers or consolidated to lower expenses • Overcomes these problems resulting from individual perspectives • Limited economies of scale • Limited information sharing • Excessive transportation expense
Figure 6.1Logistics requirements + Forecasts (sales, marketing input, histories, accounts) + Customer orders (current orders, future committed orders, contracts) + Promotions (promotion, advertising plans) = Period demand - Inventory-on-hand - Planned receipts = Period logistics requirements
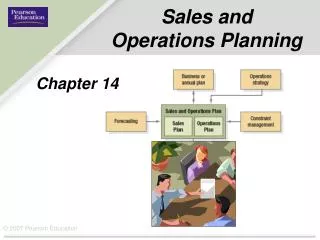
Sales & operations planning (S&OP) • Sales & operations planning is an integrated combination of • Information systems (financial, marketing and supply chain planning) • Organizational processes • Personal responsibility and accountability • Using this S&OP combination, the operations and sales groups must overcome conflicts to develop consensus and then execute their collaborative plans
Traditional conflicts between sales and operations groups must be resolved to reach consensus Figure 6.2 Planning Process Conflicts
An overview of the S&OP process illustrating 5 major plans to be integrated 1 2 5 3 4 Figure 6.2 S&OP Process
Making S&OP work in an organization requires senior leadership involvement • Functional leadership from all key operating areas must be committed to the S&OP process and be responsible for achieving success • Tie manager’s compensation to successful S&OP performance • Include regular involvement and accountability at the general management level
8 keys to successful S&OP implementation from Table 6.1 • Executing the process every month • Process ownership and clarity of roles and responsibilities • Organizational commitment to achieving high forecast accuracy • Focus should be on the next 3 to 12 months • One integrated plan that integrates the actions of the entire organization • Senior management decision making • Measuring end-to-end supply chain performance • S&OP forecast versus operating plan or budget
Figure 6.4APS framework Period 3 Period 2 Period 1
Resource Management Requirements Optimization Demand Management Resource Allocation ERP/Legacy System Figures 6.5APS system components
Supply chain planning benefits • Facilitates more effective planning with shorter cycle times. • Offer capability to consider the extended supply chain and make appropriate trade-offs to achieve optimal performance. • More effective and responsive planning allows a more level assignment of resources for existing sourcing, production, storage, and transportation capacity.
Benefits of integrated business planning • Greater integration with enterprise financial plans. • Increased inclusion of strategic initiatives and activities. • Improved simulation and modeling of alternatives. • Easier translation between aggregate and detailed planning levels.
Collaborative planning, forecasting and replenishment (CPFR) • CPFR coordinates the requirements planning process between supply chain partners for demand creation and demand fulfillment activities • Process initiated by the consumer products industry • Developed to reduce unplanned and uncoordinated events that distort the smooth flow of product throughout the supply chain
CPFR process steps • Develop a joint business plan • Create a joint calendar to determine product flow • Create a common sales forecast based on shared knowledge of each trading partner’s plan • Share common forecast between retailer and suppliers • Use an iterative process to share the forecast and requirements plan • Use the common sales forecast to develop • Production plan • Replenishment plan • Shipment plan
Basic relationships for CPFR illustrated in a retail situation Figure 6.6 CPFR in the Retail Information Technology Environment
Forecasting • Forecast is the specific definition of what is projected to be sold, when and where • Forecasting is a critical capability • Many logistics and supply chain activities must be completed in anticipation of a sale • Forecasting approaches to achieve enhanced service or reduced inventory • Improve forecast accuracy • Forecast at a higher level of aggregation
Forecasting is influenced by replenishment time and economies of scale Table 6.3 How Product Characteristics Influence The Need To Forecast
Forecasting requirements • Forecasts match the product requirements of customers with capacity of the enterprise and supply chain • Forecasts must be more timely and accurate to align • Customer demands for higher service levels and more product variations with • A management focus to reduce supply chain assets
Logistics forecasts are necessary to • Support collaborative planning • Collaborative forecasts help avoid inventory excesses and out-of-stock situations • Common goals are needed to develop effective operating plans • Drive requirements planning to determine • Inventory projections • Replenishment requirements • Production requirements • Improve resource management through cost trade-offs of strategies such as • Extra production capacity • Extra storage capacity • Speculative production or product movement • Outsourcing
Forecasting model components for time period t Forecast = Ft Irregular Base demand Seasonal Trend Cyclic Promotion × × × × + Bt Bt St T Ct Pt I
Description of model components • Base demand is long-term average demand after other components are removed • Seasonal component is annual recurring upward or downward movement in demand • E.g. Toy demand before Christmas • Trend component is long-range shift in periodic sales • Positive, negative or neutral • Cyclic component is periodic shifts in demand lasting more than a year • E.g. Housing demand follows business economic cycle • Promotional component is demand swings initiated by a firm’s marketing activities • Advertising, deals, or promotions • Irregular component includes random or unpredictable quantities that do not fit other components
Components of an effective forecast management process Figure 6.7 Forecast Management Process
Description of forecast management process components • Forecast database must include timely historical and planning information • Must facilitate data manipulation, summarization, analysis and reporting • E.g., Open orders, demand history, marketing tactics, economy, competitor actions • Technique is the computational method used to combine model components into a forecast quantity • E.g., time-series or correlation modeling • Support system must facilitate the maintenance, updating and manipulation of the database and the forecast • Administration includes organizational, procedural, motivational, cross-functional and personnel aspects of forecasting
Meaningful forecast process requires integrated and consistent combination of components • Faulty communications are costly for supply chains • Seek to reduce forecast inconsistency across multiple members of the supply chain • Efforts to perfect a single component do not overcome need for other components • Process design should consider strengths and weaknesses of each individual component • Design for optimal performance of integrated system
Bullwhip effect showing requirements error amplification between supply chain partners Figure 6.8 Response of a Simulated Production / Distribution System to a Sudden 10 Percent Increase in Sales at the Retail Level
Criteria for evaluating applicability of forecasting techniques • Evaluate technique both quantitatively and qualitatively for • Accuracy • Forecast time horizon • Value of forecasting to business strategy • Data availability • Type of data pattern • Experience of the forecaster
Categories of forecast techniques • Qualitative relies on expert opinion and special information • Costly and time-consuming • Ideal for situations with little historical data or when much managerial judgment are required • Developed using surveys, panels and consensus meetings • Time series focuses entirely on historical patterns and pattern changes to generate forecasts • “The past is a good predictor of the future” • E.g., moving averages, exponential smoothing, extended smoothing, and adaptive smoothing • Causal uses specific information to develop relationships between lead events and forecasted activity • E.g., simple or multiple regression
Forecast techniques from Table 6.4 Moving average Exponential smoothing Time series Regression Multivariate An unweighted average of the previous periods of sales An exponentially weighted moving average using smoothing constants to place greater weights on more recent demands Uses time period as the independent variable to predict future demand patterns Uses other independent variables, such as price, promotion plans, or related product volumes, to predict sales Uses more complex statistical techniques to identify more complex demand history relationships; techniques include spectral analysis, Fourier analysis, transfer functions, and neural networks
Forecasting accuracy refers to the difference between forecasts and actual sales • Improving accuracy of forecasts requires error measurement followed by analysis • Choice of method for error measurement • Simple average error can hide problems as positive errors are offset by negative ones • Mean absolute deviation (MAD) evaluates absolute error by ignoring the sign of the error • Mean absolute percentage error (MAPE) is mean MAD divided by mean demand
Illustration of alternative measures of forecast error Table 6.5 Monthly Personal Computer Demand and Forecast
Illustration of how relative forecast error will vary based on the level of measurement Figure 6.9 Comparative Forecast Errors