Download
1 / 25
250 likes | 361 Views
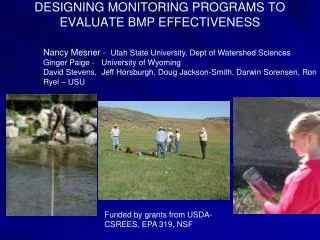
Nancy Mesner - Utah State University, Dept of Watershed Sciences Ginger Paige - University of Wyoming David Stevens, Jeff Horsburgh, Doug Jackson-Smith, Darwin Sorensen, Ron Ryel – USU. DESIGNING MONITORING PROGRAMS TO EVALUATE BMP EFFECTIVENESS.

E N D
Nancy Mesner - Utah State University, Dept of Watershed Sciences Ginger Paige - University of Wyoming David Stevens, Jeff Horsburgh, Doug Jackson-Smith, Darwin Sorensen, Ron Ryel – USU DESIGNING MONITORING PROGRAMS TO EVALUATE BMP EFFECTIVENESS Funded by grants from USDA-CSREES, EPA 319, NSF
Examples from the Little Bear River CEAP Project
Pre-treatment problems: Bank erosion, manure management, flood irrigation problems
Treatments: • bank stabilization, • river reach restoration, • off-stream watering, • improved manure and water management
Common problems in BMP monitoring programs: Failure to design monitoring plan around BMP objectives A failure to understand pollutant pathways and transformations and sources of variaiblity in these dynamic system. Tend to draw on a limited set or inappropriate approaches
Failure to design monitoring plan around BMP objectives • A failure to understand pollutant pathways and transformations and sources of variaiblity in these dynamic system. • Tend to draw on a limited set or inappropriate approaches Designing monitoring to address specific objectives v Little Bear River Watershed, Utah
Total Observations at Watershed Outlet site Discharge Total phosphorus 1976 - 2004: 162 241 1994 - 2004: 72 99 1994 11 13 1995 10 13 1996 10 13 1997 11 4 1998 6 10 1999 7 10 2000 6 5 2001 4 7 2002 2 8 2003 4 8 2004 1 8 Number of observations each year
Failure to design monitoring plan around BMP objectives • A failure to understand pollutant pathways and transformations and sources of variability in these dynamic system. • Tend to draw on a limited set or inappropriate approaches
Since 2005, measure flow and turbidity at 30 minute intervals Stage recording devices to estimate discharge Turbidity sensors Dataloggers and telemetry equipment http://www.campbellsci.com http://www.ftsinc.com/ http://www.campbellsci.com
Storm Event Capturing pollutant movement from source to waterbody.
The relative importance of different sources of variability Sampling frequency Regressions of TP and turbidity
Failure to design monitoring plan around BMP objectives A failure to understand pollutant pathways and transformations and sources of variability in these dynamic system. Tend to draw on a limited set or inappropriate approaches
Problems with “one-size-fits-all” monitoring design Above Problem: excess sediment Average flow = 20 cfs BMP = series of in-stream sediment basins Below
Problem: excess phosphorus Average flow = 1000 cfs BMP = fence cattle OUT of riparian area and revegetate
Focuses on the considerations and decisions necessary as a project is first being considered. NOT a “how-to” manual of protocols Document in review Training workshops underway
What is your objective? • Long term trends? • UPDES compliance? • Educational? • Assessment for impairment? • Track response from an implementation?
How do pollutants “behave” within your watershed. • How does the pollutant move from the source to the waterbody? • How is the pollutant processed or transformed within a waterbody? • What is the natural variability of the pollutant? Will concentrations change throughout a season? Throughout a day? • What long term changes within your watershed may also affect this pollutant? • What else must be monitored to help interpret your data?
What to monitor? • Monitor the pollutant(s) of concern? • Monitor a “surrogate” variable? • Monitor a response variables? • Monitor the impacted beneficial use? • Monitor the BMP itself? • Monitor human behavior? • Model the response to a BMP implementation. • Collect other data necessary to interpret monitoring results OR calibrate and validate the model?
Choose appropriate monitoring or modeling Above-treatment monitoring stations Control Treatment “A” Below-treatment monitoring stations Sampling points Above and below treatment design BACI Design
How to monitor? • points in time versus continuous • integrated versus grab samples • consider: • cost • skill and training required • accessibility of sites
The road to more effective monitoring…. • Monitoring plans require careful thought before anything is implemented. • Consider how the data will be used to demonstrate change. • Use your understanding of your watershed and how the pollutants of concern behave to target monitoring most effectively • Use different approaches for different BMPs