Download
1 / 49
490 likes | 653 Views
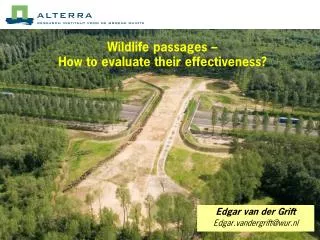
Wildlife passages – How to evaluate their effectiveness?. Edgar van der Grift Edgar.vandergrift@wur.nl. Worldwide many wildlife passages in all forms/sizes, but…. Dassentunnel. …do they work?. Much baseline information about passage performance available!. Knowledge gab 1.

E N D
Wildlife passages – How to evaluate their effectiveness? Edgar van der Grift Edgar.vandergrift@wur.nl
Worldwide many wildlife passages in all forms/sizes, but…. Dassentunnel
Much baseline information about passage performance available!
Knowledge gab 1 Many studies about passage use… But little knowledge about passage effectiveness!
Knowledge gab 2 Some studies address effectiveness… But in most of them the effectiveness of wildlife passages on population persistence remains unclear!
Wildlife passage use Studying use is not useless! However: • Use ≠ Effectiveness • Use does not provide evidence for effects of wildlife passages on population persistence !
Use ≠ Effectiveness 3 x 1 badger? Research: 3 crossings of badger per time period T But: what does it mean? 1 x 3 badgers?
Use ≠ Effectiveness 1 x 3 badgers After road construction: Before road construction: 3 x 3 badgers Usually no monitoring “before” !
Wildlife passage effectiveness Definition: The extent to which the objectives (= desired effect) for a wildlife passage are reached no objective = no effectiveness (And: no problem = no objective)
Setting “SMART” objectives S = Specific What are we going to do? M = Measurable How much? A = Acceptable Is there enough support? R = Realistic Is it possible what we want to do? T = Time frame When are we finished? Objective for each project must be specific to the location, species of concern and nature of the problem
Working out a monitoring approach • What are suitable research species? • What are suitable research sites? • What is the best study design (options)? • Which research methods (surveys/analyses) are most promising? • What measurement schemes should be used? • What are the estimated costs?
Choose appropriate research species • Species is (highly) vulnerable for road impacts • Proven use of wildlife passages • Road impact is measurable • Species allows for study design with high inferential strength
Choose appropriate research sites Species X: not viable viable highly viable Select locations where wildlife passages are expected to make a large difference (e.g. by modeling population viability) with infra without infra
Choose appropriate study design: (B)BACI, BA or CI (Roedenbeck et al., 2007) Before road Before After construction mitigation mitigation Impact Control 1 Control 2
Study design in literature review (n=123 studies): • Before-After (BA) comparison approach: n=15 • Use of controls in <10 studies • Most studies retrospective: only survey of crossing structures after construction In practice: trade-offs between perfect study design and reality! • “Before” situation already in the past • No controls, no replication • Randomisation not feasible • Limited budget • ….
Do not only include the wildlife passage in your study design! • <50% studies in literature review incorporated assessment of presence/abundance target species around wildlife crossing • Not measuring the population adjacent to road may result in wrong conclusions about wildlife passage performance Example: • Reduction in roadkill does not necessarily mean the crossing structure is effective
Importance of population surveys BEFORE AFTER Effect Example 1: Roadkill 10 5 50% ↓ Population size 100 20 15% ↑ Example 2: Roadkill 10 10 0% Population size 100 200 50% ↓
Monitoring! Photo: Bart Siebelink Photo: Bart Siebelink
Review: • Tracking pads (n=74) • Video / infra-red still cameras (n=36) • Collection/identification scats (n=16) • Direct observations (n=13) • Trapping (n=12) • Collection/identification hair (n=8) • Radio-tracking (n=7) • Trail monitors/wildlife counters (n=6) • Other (including dusting with fluorescent pigment)
Select appropriate research methods Go (sometimes) off the beaten track! Large species over-represented in existing studies, partly because of chosen research methods New techniques in development: e.g. genetics, PIT tags
Dry zone Wetland zone
Wildlife overpass Distribution amphibians across overpass Common toad Common frog Smooth newt Crested newt Green frog Number of observations 2006-2007 adults/juveniles (n=968)
Significant more amphibians in wetland zone Number of observations
Efficiency method “artificial refugia” Number of observations
Crested newts: Belly patterns Identification of individuals and individual movements across the overpass
Crested newts: Belly patterns Identification of individuals and individual movements across the overpass
Appropriate measurement scheme • Appropriate monitoring period (review: 4 nights – 8 yrs) • Appropriate frequency of measurements within period (review: 1/day – 1/week) • Appropriate number of impact and control sites Recommendation:Assessment of measurement scheme on the basis of dynamic population model simulations of monitoring
Appropriate measurement scheme Monitoring changes in populations 1 study site 10 study sites 100% 80% 60% 40% 20% 100% 80% 60% 40% 20% Survey: 26 years Survey: 12 years
Maximize inferential strength (validity) Inferential strength = high probability and low uncertainty that research result is true Dependent on: • Number of competing hypotheses tested • Extent of extrapolation • Study design • Measurement scheme
Implications • Without studies with high IS it will be difficult to prove the effectiveness of defragmentation programs and to justify investments • Correlation between increasing IS and increasing costs However: investment in a few good but costly experiments should be prefered above numerous poor experiments at low costs • Experiments with high IS carried out over the relevant temporal and spatial time scales may not be feasible in isolated studies, but may be conducted in collaborative(international) networks of researchers
Complex problem: time for collaboration...! This badger gate is for 94.68% effective!
Use ≠ Effectiveness Questions and discussion