Understanding Practical X-Ray Diffraction Techniques
Learn about X-ray diffraction techniques and their practical applications in materials engineering. Explore instrument settings, measurement types, Bragg's law, peak positions, sample preparation tips, and more.

Understanding Practical X-Ray Diffraction Techniques
E N D
Presentation Transcript
Practical X-Ray Diffraction Prof. Thomas Key School of Materials Engineering
Instrument Settings • Source • Cu Kα • Slits • Less than 3.0 • Type of measurement • Coupled 2θ • Detector scan • Etc. • Angle Range • Increment • Rate (deg/min) • Detector • LynxEye (1D) Bruker D8 Focus
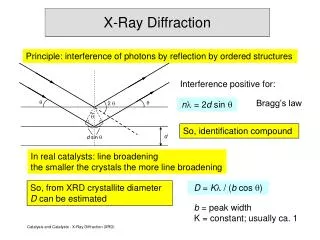
Coupled 2θ Measurements • In “Coupled 2θ” Measurements: • The incident angle w is always ½ of the detector angle 2q . • The x-ray source is fixed, the sample rotates at q°/min and the detector rotates at 2q°/min. • Angles • The incident angle (ω) is between the X-ray source and the sample. • The diffracted angle (2q) is between the incident beam and the detector. • In plane rotation angle (Φ) Detector Motorized Source Slits X-ray tube Φ w q 2q
Bragg’s law and Peak Positions. • For parallel planes of atoms, with a space dhkl between the planes, constructive interference only occurs when Bragg’s law is satisfied. • First, the plane normal must be parallel to the diffraction vector • Plane normal: the direction perpendicular to a plane of atoms • Diffraction vector: the vector that bisects the angle between the incident and diffracted beam • X-ray wavelengths l are: • Cu Kα1=1.540598 Å and Cu Kα2=1.544426 Å • Or Cu Kα(avg)=1.54278 Å • dhkl is dependent on the lattice parameter (atomic/ionic radii) and the crystal structure • Ihkl=IopCLP[Fhkl]2 determines the intensity of the peak
Sample Preparation(Common Mistakes and Their Problems) • Z-Displacements • Sample height matters • Causes peaks to shift • Sample orientation of single crystals • Affects which peaks are observed • Inducing texture in powder samples • Causes peak integrated intensities to vary
Z-Displacements 011 Disp 110 111 200 002 Detector R θ 2θ It is important that your sample be at the correct height • Tetragonal PZT • a=4.0215Å • b=4.1100Å
Z-Displacements vs. Change in Lattice Parameter Disp Change In Lattice Parameter Strain/Composition? a=4.07A c=4.16A 101/110 Tetragonal PZT 002/200 111 Z-Displaced Fit Disp.=1.5mm • Lattice Parameters • a=4.0215 Å • c=4.1100 Å Shifts due to z-displacements are systematically different and differentiable from changes in lattice parameter
Sample Preparation Crystal Orientation Matters
Orientations Matter in Single Crystals(a big piece of rock salt) 200 220 111 222 311 2q The (200) planes would diffract at 31.82 °2q; however, they are not properly aligned to produce a diffraction peak The (222) planes are parallel to the (111) planes. At 27.42 °2q, Bragg’s law fulfilled for the (111) planes, producing a diffraction peak.
For phase identification you want a random powder (polycrystalline) sample 200 220 111 222 311 2q 2q 2q • When thousands of crystallites are sampled, for every set of planes, there will be a small percentage of crystallites that are properly oriented to diffract • All possible diffraction peaks should be exhibited • Their intensities should match the powder diffraction file
Sample Preparation Inducing Texture In A Powder Sample
Preparing a powder specimen • An ideal powder sample should have many crystallites in random orientations • the distribution of orientations should be smooth and equally distributed amongst all orientations • If the crystallites in a sample are very large, there will not be a smooth distribution of crystal orientations. You will not get a powder average diffraction pattern. • crystallites should be <10mm in size to get good powder statistics • Large crystallite sizes and non-random crystallite orientations both lead to peak intensity variation • the measured diffraction pattern will not agree with that expected from an ideal powder • the measured diffraction pattern will not agree with reference patterns in the Powder Diffraction File (PDF) database
An Examination of Table Salt 200 <100> 111 220 222 311 NaCl With Randomly Oriented Crystals Hint Typical Shape Of Crystals It’s the same sample sprinkled on double stick tape but after sliding a glass slide across the sample Salt Sprinkled on double stick tape What has Changed?
Texture in Samples • Common Occurrences • Plastically deformed metals (cold rolled) • Powders with particle shapes related to their crystal structure • Particular planes form the faces • Elongated in particular directions (Plates, needles, acicular,cubes, etc.) • How to Prevent • Grind samples into fine powders • Unfortunately you can’t or don’t want to do this to many samples.
A Simple Means of Quantifying Texture • Lotgering degree of orientation (ƒ) • A comparison of the relative intensities of a particular family of (hkl) reflections to all observed reflections in a coupled 2θ powder x-ray diffraction (XRD) Spectrum • ƒ is specifically considered a measure of the “degree of orientation” and ranges from 0% to 100% • po is p of a sample with a random crystallographic orientation. • Ihkl is the integrated intensity of the (hkl) reflection Where for (00l) Jacob L. Jones, Elliott B. Slamovich, and Keith J. Bowman, “Critical evaluation of the Lotgering degree of orientation texture indicator,” J. Mater. Res., Vol. 19, No. 11, Nov 2004
Phase Identification One of the most important uses of XRD
For cubic structures it is often possible to distinguish crystal structures by considering the periodicity of the observed reflections.
Phase Identification • One of the most important uses of XRD • Typical Steps • Obtain XRD pattern • Measure d-spacings • Obtain integrated intensities • Compare data with known standards in the • JCPDS file, which are for random orientations • There are more than 50,000 JCPDS cards of inorganic materials
Measuring Changes In A Single Phase’s Composition by X-Ray Diffraction
Vegard’s Law Good for alloys with continuous solid solutions • Ex) Au-Pd • To create the plot on the right • Using the crystal structure of the alloy calculate “a” for each metal • Draw a straight line between them as shown on the chart to the left. • To calculate the composition • Calculate “a” from d-spacings • “a” will be an atomic weighted fraction of “a” of the two metal
Measuring Changes In Phase Fraction Using I/Icor and Direct Comparison Method
1 • Using I/Icorr • Where • ω= weight fraction • I(hkl)=Reference’s relative intensity • Iexp(hkl)=Experimental integrated intensity Phase Fractions
Because this is already a complicated method, many choose to go ahead and use Rietveld Refinement • Direct Comparison Method • Where • v=Volume fraction • V=Volume of the unit cell Phase Fractions
Strain Effects Peak Shifts and Peak Broadening
Other Factors contributing to contribute tothe observed peak profile
Many factors may contribute tothe observed peak profile • Instrumental Peak Profile • Slits • Detector arm length • Crystallite Size • Microstrain • Non-uniform Lattice Distortions (aka non-uniform strain) • Faulting • Dislocations • Antiphase Domain Boundaries • Grain Surface Relaxation • Solid Solution Inhomogeneity • Temperature Factors • The peak profile is a convolution of the profiles from all of these contributions
Crystallite Size Broadening Peak Width B(2q) varies inversely with crystallite size The constant of proportionality, K (the Scherrer constant) depends on the how the width is determined, the shape of the crystal, and the size distribution The most common values for K are 0.94 (for FWHM of spherical crystals with cubic symmetry), 0.89 (for integral breadth of spherical crystals with cubic symmetry, and 1 (because 0.94 and 0.89 both round up to 1). K actually varies from 0.62 to 2.08 For an excellent discussion of K, JI Langford and AJC Wilson, “Scherrer after sixty years: A survey and some new results in the determination of crystallite size,” J. Appl. Cryst.11 (1978) p102-113. Remember: Instrument contributions must be subtracted
Methods used to Define Peak Width Full Width at Half Maximum (FWHM) the width of the diffraction peak, in radians, at a height half-way between background and the peak maximum Integral Breadth the total area under the peak divided by the peak height the width of a rectangle having the same area and the same height as the peak requires very careful evaluation of the tails of the peak and the background Intensity (a.u.) 46.7 46.8 46.9 47.0 47.1 47.2 47.3 47.4 47.5 47.6 47.7 47.8 47.9 2 q (deg.) Intensity (a.u.) 46.7 46.8 46.9 47.0 47.1 47.2 47.3 47.4 47.5 47.6 47.7 47.8 47.9 2 q (deg.) FWHM
Williamson-Hull Plot y-intercept slope Grain size and strain broadening Grain size broadening K≈0.94 Gausian Peak Shape Assumed
Which of these diffraction patterns comes from a nanocrystalline material? These diffraction patterns were produced from the exact same sample The apparent peak broadening is due solely to the instrumentation 0.0015° slits vs. 1° slits Intensity (a.u.) 66 67 68 69 70 71 72 73 74 2 q (deg.) Hint: Why are the intensities different?
Remember, Crystallite Size is Different than Particle Size • A particle may be made up of several different crystallites • Crystallite size often matches grain size, but there are exceptions
Use 200 and 400 peaks Use 111 and 222 peaks To determine aspect ratios Anistropic Size Broadening • The broadening of a single diffraction peak is the product of the crystallite dimensions in the direction perpendicular to the planes that produced the diffraction peak.
Crystallite Shape • Though the shape of crystallites is usually irregular, we can often approximate them as: • sphere, cube, tetrahedra, or octahedra • parallelepipeds such as needles or plates • prisms or cylinders • Most applications of Scherrer analysis assume spherical crystallite shapes • If we know the average crystallite shape from another analysis, we can select the proper value for the Scherrer constant K • Anistropic peak shapes can be identified by anistropic peak broadening • if the dimensions of a crystallite are 2x * 2y * 200z, then (h00) and (0k0) peaks will be more broadened then (00l) peaks.
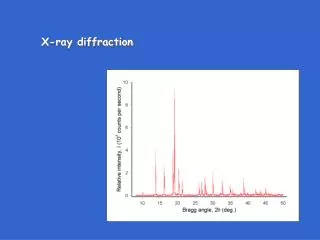
Diffraction patterns are best reported using dhkl and relative intensity rather than 2q and absolute intensity. • The peak position as 2q depends on instrumental characteristics such as wavelength. • The peak position as dhkl is an intrinsic, instrument-independent, material property. • Bragg’s Law is used to convert observed 2q positions to dhkl. • The absolute intensity, i.e. the number of X rays observed in a given peak, can vary due to instrumental and experimental parameters. • The relative intensities of the diffraction peaks should be instrument independent. • To calculate relative intensity, divide the absolute intensity of every peak by the absolute intensity of the most intense peak, and then convert to a percentage. The most intense peak of a phase is therefore always called the “100% peak”. • Peak areas are much more reliable than peak heights as a measure of intensity.
Powder diffraction data consists of a record of photon intensity versus detector angle 2q. • Diffraction data can be reduced to a list of peak positions and intensities • Each dhkl corresponds to a family of atomic planes {hkl} • individual planes cannot be resolved- this is a limitation of powder diffraction versus single crystal diffraction Raw Data Reduced dI list
Extra Examples Crystal Structure vs. Chemistry
Two Perovskite Samples What are the differences? Peak intensity d-spacing Peak intensities can be strongly affected by changes in electron density due to the substitution of atoms with large differences in Z, like Ca for Sr. Assume that they are both random powder samples SrTiO3 and CaTiO3 200 210 211 2θ (Deg.)
Two samples of Yttria stabilized Zirconia Substitutional Doping can change bond distances, reflected by a change in unit cell lattice parameters The change in peak intensity due to substitution of atoms with similar Z is much more subtle and may be insignificant Intensity(Counts) 45 50 55 60 65 2θ (Deg) Why might the two patterns differ? 10% Y in ZrO2 50% Y in ZrO2 R(Y3+) = 0.104Å R(Zr4+) = 0.079Å
Free Software • Empirical Peak Fitting • XFit • WinFit • couples with Fourya for Line Profile Fourier Analysis • Shadow • couples with Breadth for Integral Breadth Analysis • PowderX • FIT • succeeded by PROFILE • Whole Pattern Fitting • GSAS • Fullprof • Reitan • All of these are available to download from http://www.ccp14.ac.uk
Dealing With Different Integral Breadth/FWHM Contributions Contributions Lorentzian (Cauchy) Gaussian Integral Breadth (PV) Lorentzian and Gaussian Peak shapes are treated differently B=FWHM or β in these equations Williamson-Hall plots are constructed from for both the Lorentzian and Gaussian peak widths. The crystallite size is extracted from the Lorentzian W-H plot and the strain is taken to be a combination of the Lorentzian and Gaussian strain terms.