Download
1 / 11
110 likes | 262 Views
A Multicomponent Latent Trait Model for Diagnosis. Susan E. Embretson Xiangdong Yang. Component. Translates between the numerical, tabular, graphical and symbolic representation of linear relationships with integer coefficients and constants. Items in Table 2. Components can be set as:

E N D
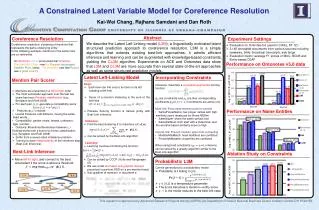
A Multicomponent Latent Trait Model for Diagnosis Susan E. Embretson Xiangdong Yang
Component Translates between the numerical, tabular, graphical and symbolic representation of linear relationships with integer coefficients and constants. • Items in Table 2. • Components can be set as: • 1. Number/Computation; 2. Algebra; 3. Geometry; 4. Data • Can also be set as (Processing stages): • 1. Translation; 2. Integration; 3. Solution Planning; 4. Solution Execution; • 5. Decision Processing. Computational burden, and procedural complexity
MLTM • Multicomponent latent trait models (1980) • To reproduce test performances from both person and item parameters on the underlying information processes.
GLTM • General latent trait model (1984) • Combine LLTM (Fischer, 1973) and MLTM. • Both models were developed to link item responses to the theoretical variables that influence performances.
MLTM-D C-matrix: Relation between items and components Q-matrix : Relation between components and attributes.
Simulation– parameter recovery • Person: 1000, , correlation (0.3, 0.4, 0.5) • Item: 60, up to 3 components, 6 blocks, difficulty ~ N(-1, 1) • Attribute: 2 • Variance of erorr: 0/ 0.10
Application • High-stakes test of mathematics achievement • 3000 8th-grade students • 4 standards (Number/Computation; Algebra; Geometry; Data Analysis) • 25 indicators • 86 multiple choice items. • Three models: • Full component model • Restricted hierarchical model • Null model
Compare with CDMs • 1. Number of parameters to be estimated. • 2. Conceptualization about the nature of competency. • 3. Type of test for which the model are most appropriate. • CDMs – short test, homogeneous items. • MLTM-D – long test, heterogeneous • items, various skills, • hierarchical structure.
Models for diagnosis • Confirmatory models. • Theoretical background.