Download
1 / 71
720 likes | 1.07k Views
Organic Chemistry II Nuclear Magnetic Resonance Spectroscopy. Dr. Ralph C. Gatrone Department of Chemistry and Physics Virginia State University. Light. Brief History of NMR (nuclear magnetic resonance). 1933 Stern and Gerlach

E N D
Organic Chemistry IINuclear Magnetic Resonance Spectroscopy Dr. Ralph C. Gatrone Department of Chemistry and Physics Virginia State University
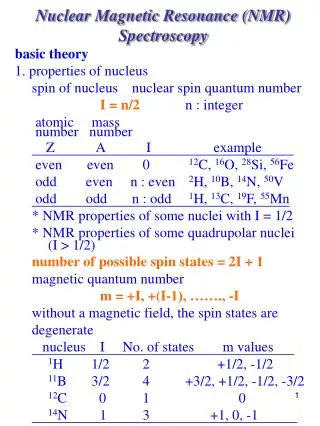
Brief History of NMR(nuclear magnetic resonance) • 1933 • Stern and Gerlach • Molecular beam experiments allowed them to detect a nuclear magnetic moment • 1936 • Rabi at Columbia observed nuclear resonance • 1943 • Stern awarded the Nobel prize for physics
Brief History of NMR • 1945 • Purcell, Torey and Pound (Harvard) built instrument to detect the transition between nuclear magnetic energy levels using Rf • 1952 • Bloch and Purcell share Nobel Prize in physics • 1961 • Shoolery introduces the Varian A-60 spectrometer
The Nucleus • Positively charged • Behave as if they were spinning • A spinning positive charge is a magnet • Generally randomly oriented in space • In presence of strong external magnet • Align in space with or opposed to external magnetic field
Nucleiout of and in a magnetic field • Align with (parallel) field or against (antiparallel) field
The Nuclei • Parallel spins are slightly lower in energy • Parallel spins are slightly favored state • Energy difference is dependent upon strength of the external field
Electromagnetic Radiation • Apply electromagnetic radiation to nuclei in a magnetic field • The proper frequency causes the lower energy state to “spin flip” to the higher energy state • The nuclei that spin flip are said to be in resonance.
Resonance • Frequency necessary depends upon • Strength of the external field • Identity of the nucleus • Field strength • 4.7 T (Tesla) to 7.0T • Radiofrequency of 200MHz at 4.7T needed • for 1H • Radiofrequency of 50MHz at 4.7T needed • for 13C
Energies • Very low energies are involved • 200MHz = 8 X 10⁻⁵ kJ/mole
Time Scale • IR: vibrational changes • Instantaneous process • 10-13 sec • NMR: magnetic spin flip • Slower process • 10-3 sec
NMR Active Nuclei • 1H and 13C • D, 14N, 19F, 31P • All nuclei with odd number of protons • All nuclei with odd number of neutrons • Absorption frequency for nuclei is different within any given molecule
The NMR ExperimentContinuous Wave • Sample is dissolved in suitable solvent • Solvent is generally CDCl3 (no protons) • Placed in thin glass tube (highly purified glass is used) • Tube is placed in magnetic field • Radiofrequency is used to excite nuclei and to spin flip • Field strength increases left to right • Left: downfield, low field, little shielding • Right: upfield, high field, more shielding • Schematic shown:
Continuous WaveNMR • Each set of distinct nuclei are irradiated separately • Sweep must be done slowly (5 – 10 minutes) • Not very efficient • It is more efficient to excite all nuclei simultaneously • FT NMR
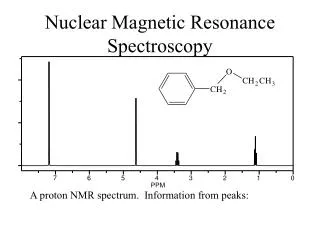
Why is nmr useful? • Absorption frequency for different nuclei is different within any given molecule.
Electron Density(around C-H bond) • The electron density is dependent upon what is attached to the C. • Z: electron withdrawing • C is electron deficient, drawing electron density from the C-H bond • Z: electron donating • more electron density is in C-H bond
So! • More electron density around a proton, it experiences a slightly lower magnetic field • Less electron density it experiences a higher magnetic field • The electrons in a bond shield the nuclei from the magnetic field.
How do the electrons shield the magnetic field? • By moving. A moving charge creates a magnetic field, and the field created by the moving electrons opposes the magnetic field of our NMR machine. It’s not a huge effect, but it’s enough to enable us to distinguish between different protons in our sample.
Resonance Frequency • Nuclei in molecule are surrounded by e- • In a magnetic field, nuclei act as magnets • In a magnetic field, electrons act as magnets • Local magnetic fields oppose the applied field • Therefore, Beffective = Bo - Blocal • Nuclei are shielded by the electrons • Electronic environment different for each nucleus • Each nucleus is shielded differently • Different nmr signal for each chemically distinct nucleus
NMR Spectra • Horizontal axis = effective field strength • Vertical axis = intensity of absorption • Each peak corresponds to chemically distinct proton or carbon • Cannot record proton and carbon at the same time • Different energy needed to spin flip
Interpretation of Data(Spectra to Structure) • An NMR spectrum is a puzzle and nothing you can memorize will help you solve these puzzles. • You need to consider lots of data and propose a structure that fits all of the data.
The Data • A Proton NMR spectrum gives us 3 pieces of data: • 1. the chemical shift • What kind of protons do we have? • What is the electronic environment? • 2. the integral • The relative number of protons present • 3. proton – proton coupling • What protons are near the signal we are considering?
The Chemical Shift • NMR is calibrated to a reference • (CH3)4Si, tetramethylsilane • Generally most upfield peak • The peak for a nucleus resonates at its chemical shift • Arbitrarily TMS is set to 0 delta • 1 delta = 1ppm of the spectrometer operating field • At 200MHz: 1ppm = 1/200, 000, 000Hz = 200Hz • At 500MHz: 1ppm = 500Hz • 1ppm = 1ppm • Chemical shift for a given nucleus is constant regardless of the operating frequency of the spectrometer. • Range: 1H: 0 – 10ppm and 13C: 0 – 220ppm
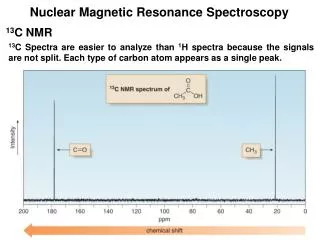
The Spectra(methyl acetate) • 1H: two signals • chemically identical protons have identical absorptions • 13C: three signals
1H NMR Experiments • Hydrogen isotopes • 1H: 98.98% • 2H: 0.0156% natural abundance • 3H: trace • High natural abundance of 1H makes this the most sensitive element for NMR
13C NMR Experiments • Carbon isotopes • 12C: 98.9% • 13C: 1.1% natural abundance • 14C: trace • Low abundance overcome by signal averaging and Fourier transform NMR • Increases sensitivity and speed of operation
Fourier Transform • Jean Baptiste Joseph Fourier • 1768 – 1830 • Propagation of heat in solid bodies • Trigonometrical series • Partial differential equations • Used in FT-NMR
FT-NMR • Low abundance leads to noisy spectral data • Weak signals that are cluttered with background electronic noise • Noise is eliminated by running hundreds or thousands of spectra and averaging the data • Noise averages to zero • Signals stand out
The FT-NMR Experiment • Magnetic field is held constant • Short pulse of rf covering entire range of frequencies • All nuclei resonate simultaneously • Complex, composite signal (Free Induction Decay) is mathematically manipulated to give spectrum
FT NMR • Sample is exposed to a short burst of rf • 10 – 100 micro seconds • 10,000 X stronger than used in CW • All nuclei are excited • Relaxation occurs exponentially • Collect and store each FID • FID data are averaged. • Signal from a weak sample is useful. • Very useful for low abundance nuclei.
Carbon Chemical Shifts • 0 – 220ppm downfield from TMS • Exact chemical shift is dependent upon the electronic environment • Dependent upon electronegativity of nearby atoms • C-X (X = O, N, or halogen) downfield from alkane C • sp3 : 0 – 90ppm • sp2: 110 – 220ppm • C=O always at low field end of the spectrum
DEPT 13C NMR • Distortionless Enhancement by Polarization Transfer • Distinguishes between CH3, CH2, CH, and quaternary carbons • Three nmr experiments are done: • 1. broadband-decoupled: • all Carbons • 2. DEPT-90: • provides C-H shifts • 3. DEPT-135: • CH3 and CH positive peaks • CH2 are negative peaks
DEPT-90 DEPT DATA DEPT-135
Interpretation of DEPT Data • C: subtract DEPT-135 from regular spectrum • CH: DEPT-90 • CH2: Negative DEPT-135 • CH3: Subtract DEPT-90 from positive DEPT-135
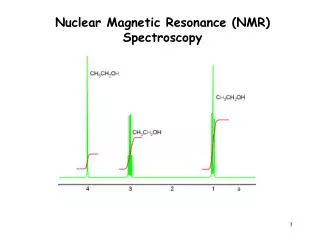
1H NMR • 99.98% isotopic abundance • Each electronically distinct proton in a molecule has a distinct absorption • Look at methyl acetate spectral data
Chemical Shifts • Strongly shielded nuclei • Upfield side of spectrum (right) • Less strongly shielded nuclei • Downfield side of spectrum (left) • Data is divided into five regions
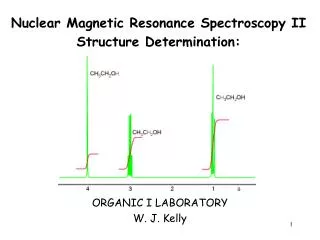
Integration of Proton NMR Spectra • Peak size is proportional to number of protons resonating • Integrate area under each peak • Get relative number of each kind of proton • Example
NMR of Methyl Pivalate Integration of both peaks 1:3 ratio