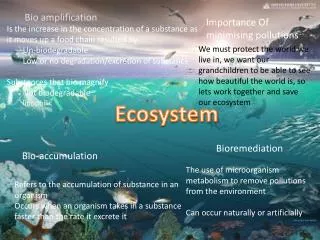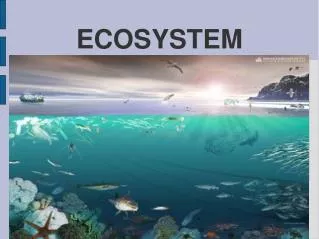

Ocean Ecosystem
E N D
Presentation Transcript
Goal: To understand the factors (both biotic and abiotic) that control the distribution and abundance of life in the oceans
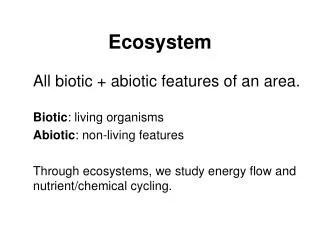
Ecosystem Review Ecosystem:“Any area of nature that includes living organisms and non-living substances that interact to produce and exchange of materials between living and non-living parts is an ecological system or ecosystem.” (E.P.Odum) Ecosystems consist of 4 components: abiotic, producers, consumers, and decomposers;
Ecology is the study of the inter-relationships between the physical and biological aspects of the environment. It is the study of how organisms adapt to their environment and in turn alter it. 9
Ecosystem Review • Biotic Components of the Ecosystem • plants • animals • bacteria • Abiotic Components of the Ecosystem • geological • basin shape, size, & topography • physical • temperature, currents, pressure, light) • chemical • carbon, nitrogen, phosphorus, oxygen, salinity, trace metals, vitamins
The Environment • The ocean water column can be separated into 2 distinct zones: the surface zone and the deep zone • Surface zone • extends down to about 100- 300 meters • well mixed • known as the “mixed layer” • includes the photic zone • Deep zone • the rest of the water column • dark and cold with much less productivity • includes the aphotic zone • the pycnocline forms a physical barrier between the surface and deep zones
Production • There are two types of organisms in any given ecosystem: autotrophs and heterotrophs • autotrophs make their own food (organic matter) from inorganic nutrients (C, N, P, S, trace metals and vitamins) and either light or chemical energy, they ‘fix’ CO2 • they ‘fix’ CO2 via photosynthesis (light E) or chemosynthesis(chemical E, i.e. H2S) • autotrophs form the base of the food web (i.e. primary producers) and are ultimately responsible for all life in the world’s oceans • marine examples include phytoplankton, cyanobacteria, and sulfide oxidizing bacteria (i.e. at hydrothermal vents) • phytoplankton are the most abundant primary producers in the oceans 6 CO2 + 12 H20 C6H12O6 + 6 H2O + 6 O2 light OR chemical E
Hydrothermal vents – ‘primary production’ is done by a type of extremophile, that is, a type of microorganism that can thrive under extreme env. conditions (temp > 80° C or below 90° C); these extremophiles are also chemoautotrophs – they use hydrogen and sulfur compounds as sources of energy (with or without oxygen) (chemosynthesis);
Production(cont’d) • autotrophs vs heterotrophs (cont’d) • heterotrophs consume food (organic matter) that has already been produced • they derive energy (ATP) from the breakdown of organic compounds via respiration • when there is no light (i.e. at night or in deeper waters) phytoplankton and cyanobacteria respire the organic compounds that they produced during photosynthesis • examples of marine heterotrophs include all marine animals and most marine bacteria C6H12O6 + 6 O2 6 CO2 + 6 H2O + ATP
Production(cont’d) • Productivity is high in the surface waters (i.e. photic zone), due to ample sunlight for photosynthesis, and then decreases with depth (i.e. aphotic zone)
Production(cont’d) • The critical depth is where total production (PT) equals • total respiration (RT): PT = RT • occurs at the 1% light level
Production(cont’d) • Productivity is highest in coastal waters and upwelling zones due to higher nutrient concentrations Average Global Primary Production (Chl a) March 6-13 2001 Terra MODIS NASA/GES/DISC/DAAC
Bands of the dionflagellate Lingulodinium polyedrum moving onshore over the troughs of a series of internal waves Phytoplankton Blooms
Lingulodinium polyedrum: ~50 μm. Neritic; warm temperate to tropical waters; forms large blooms off of California; can be toxic.
MixedMarinePlanktonPlants animals larvae adults vertebrates invertebrates carnivores and herbivores are all represented in the plankton community.
NASASeaWiFS satellite image of the large phytoplankton bloom in the Bering Sea in 1998
DinoflagellateGonyaulaxsp.A sudden growth or bloom of the dinoflagellate, Gonyaulax, causes "red tide" . Humans have died from eating infected clams and mussels.
Antarctic krill, 3.8 cm long Northern krill
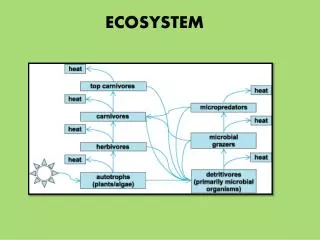
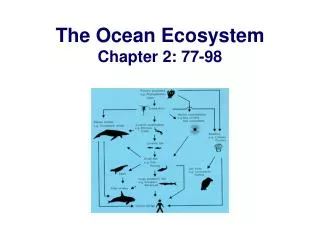
Trophic Interactions • To understand ocean ecology we need to know how the • autotrophic and heterotropic components are related • to each other (i.e. energy transfer and exchange) • we examine trophic level dynamics • trophic levels describe who eats whom
Trophic Interactionscont’d • The traditional view in ecology viewed these interactions linearly • as a FOOD CHAIN:phytoplankton zooplankton fish • This food chain view is really too simplistic, it’s really more like • a FOOD WEB with many links and complex branching between • and among the various trophic levels
One Ocean Drop: 1000s of planktons… Radiolaria Foraminifera Diatoms
http://en.wikipedia.org/wiki/File:Cc3s.gif • http://www.youtube.com/watch?v=kjp_jumlO3A • www.youtube.com/watch?v=eyCigZ_bsTM Jellyfish invasion
Trophic Interactionscont’d • The abundance of biomass in each link is dependent on the food • supply to that link
Trophic Interactionscont’d • At each step in the food web, some energy is transferred to the next level and some energy is lost • This relationship can be depicted as a trophic pyramid • the shape shows the loss of energy as you move upward • On average, only about 10% of the energy from one trophic level is transferred to the next trophic level
Trophic Interactionscont’d • Areas of high productivity (high nutrients and ample sunlight) • have less trophic levels, therefore less energy is lost and more • energy is available to the next trophic level (greater fish catch!) • upwelling areas have 20% energy transfer efficiencies • coastal areas have 15% energy transfer efficiencies • open oceans globally averaged have only a 10% energy transfer efficiency COASTAL OPEN OCEAN UPWELLING
Normal conditionsEl Nino conditions http://www.forces.si.edu/
In 1735 Linnaeus developed the taxonomic classification used in zoology. The categories are from largest to smallest: kingdom, phylum, class, order, family, genus and species. Classification of Organisms
Marine organisms can be classified by lifestyle: Planktonare the organisms which float in the water and have no ability to propel themselves against a current. They can be divided into phytoplankton (plants) and zooplankton (animals). Nekton are active swimmers and include marine fish, reptiles, mammals, birds and others. Benthos are the organisms which live on the bottom (epifauna) or within the bottom sediments (infauna). Some organisms cross from one lifestyle to another during their life, for example being planktonic early in life and benthonic later. Crab larva – in plankton
Plankton include plants (phytoplankton) and animals (zooplankton). More than 90% of marine plants are algae and most are unicellular and microscopic. To photosynthesize (produce organic material from inorganic matter and sunlight) plants must remain within the photic zone. Diatoms are single-celled plants enclosed in a siliceous frustrule (shell) that is shaped like a pillbox. Dinoflagellates are single-celled plants with two whip-like tails (flagella).
Zooplankton include the foraminifera & copepods Foraminifera are single-celled animals which build shells of calcium carbonate. 1 mm
Copepods are small herbivores (plant-eating organisms) that filter diatoms from the water.
Suspension feeding invertebrates – sponges, bryozoans, corals add structural complexity and offer a great variety of microhabitat for a diversity of species
www.mcbi.org Before trawling www.mcbi.org Deep sea bottom trawling poses the greatest threat to the coral habitats It does not just take away targeted fish species There is a considerable amount of bycatch and corals are a major part of it After trawling www.mcbi.org
Seamounts – underwater mountains rising >1000m from the seabed without breaking the oceans’ surface • generally of volcanic origin • often occur in chains or cluster resulting from a seafloor hot spot • 30 000-100 000 seamounts worldwide Global seamount distribution map DSCC Policy Paper : Seamounts and cold-water corals
RV Atlantis DSV Alvin
In 1735 Linnaeus developed the taxonomic classification used in zoology. The categories are from largest to smallest: kingdom, phylum, class, order, family, genus and species. Classification of Organisms