Download
1 / 1
10 likes | 122 Views
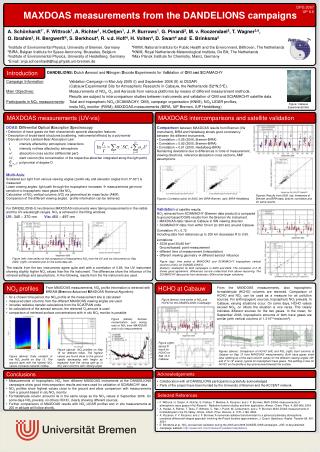
DPG 2007 UP 8.6. A. Schönhardt 1* , F. Wittrock 1 , A. Richter 1 , H.Oetjen 1 , J. P. Burrows 1 , G. Pinardi 2 , M. v. Roozendael 2 , T. Wagner 3,6 , O. Ibrahim 3 , H. Bergwerff 4 , S. Berkhout 4 , R. v.d. Hoff 4 , H. Volten 4 , D. Swart 4 and E. Brinksma 5

E N D
DPG 2007 UP 8.6 A. Schönhardt1*, F. Wittrock1, A. Richter1, H.Oetjen1, J. P. Burrows1, G. Pinardi2, M. v. Roozendael2, T. Wagner3,6, O. Ibrahim3, H. Bergwerff4, S. Berkhout4, R. v.d. Hoff4, H. Volten4, D. Swart4 and E. Brinksma5 1Institute of Environmental Physics, University of Bremen, Germany 4RIVM, National Institute for Public Health and the Environment, Bilthoven, The Netherlands 2BIRA, Belgian Institute for Space Aeronomy, Brusseles, Belgium 5KNMI, Royal Netherlands Meteorological Institute, De Bilt, The Netherlands 3Institute of Environmental Physics, University of Heidelberg, Germany 6Max Planck Institute for Chemistry, Mainz, Germany *Email: anja.schoenhardt@iup.physik.uni-bremen.de Introduction DANDELIONS: Dutch Aerosol and Nitrogen Dioxide Experiments for Validation of OMI and SCIAMACHY Campaign Information: Validation Campaign in Mai-July 2005 (I) and September 2006 (II) at CESAR (Cabauw Experimental Site for Atmospheric Research) in Cabauw, the Netherlands (52°N,5°E). Main Objectives: Measurements of NO2, O3 and Aerosols from various platforms by means of different measurement methods. Results are subject to intercomparison studies between instruments and validation of OMI and SCIAMACHY satellite data. Participants in NO2 measurements: Total and tropospheric NO2 (SCIAMACHY, OMI), campaign organisation (KNMI), NO2 LIDAR profiles, insitu NO2 monitor (RIVM), MAXDOAS measurements (BIRA, IUP Bremen, IUP Heidelberg) MAXDOAS measurements from the DANDELIONS campaigns Figure: Cabauw Experimental Site MAXDOAS measurements (UV-vis) MAXDOAS intercomparisons and satellite validation • DOAS: Differential Optical Absorption Spectroscopy • Detection of trace gases via their characteristic spectral absorption features • Description of broad-band structures (scattering, instrumental effects) by a polynomial • Derivation from Lambert-Beer Absorption Law: • I intensity affected by atmospheric interactions • I0 intensity not/less affected by atmosphere • s’ absorption cross section (differential part) • SCi slant column (the concentration of the respective absorber integrated along the light path) • polynomial of degree D • Multi-Axis: • Scattered sun light from various viewing angles (zenith-sky and elevation angles from 0°-30°) is measured • Lower viewing angles: light path through the troposphere increases measurements get more sensitive to tropospheric trace gases like NO2. • Calculation of NO2 vertical columns (VC) via geometrical air mass factor (AMF). • Comparison of the different viewing angles: profile information can be retrieved. • Comparison between MAXDOAS results from Bremen (Vis instrument), BIRA and Heidelberg shows good consistency between the different instruments. • Correlation = 0.85 (2006, Bremen-BIRA) • Correlation = 0.92 (2005, Bremen-BIRA) • Correlation = 0.91 (2005, Heidelberg-BIRA) • Remaining deviations due to differences in: time of measurement, viewing directions, reference absorption cross sections, AMF assumptions. Figures: Results from 2006. top: timeseries of Bremen and BIRA data, bottom: correlation plot for same results. Figures: Correlation plots for 2005, left: BIRA-Bremen, right: BIRA-Heidelberg For DANDELIONS-II, two Bremen MAXDOAS instruments were taking measurements in the visible and the UV wavelength ranges. NO2 is retrieved in the fitting windows: UV: 345 – 370 nm Vis: 450 – 497 nm • Validation of satellite results: • NO2 retrieved from SCIAMACHY (Bremen data product) is compared to ground-based DOAS results from the Bremen Vis instrument. • MAXDOAS data: taken at Cabauw in SW viewing direction • SCIAMACHY data: from within 50 km (or 200 km) around Cabauw • Correlation: R = 0.72 • Including data from distances up to 200 km decreases R to 0.55. • Limitations: • SCIA pixel 30x60 km² • Ground-based: point-measurement • different time of measurement (interpolation) • different viewing geometry different aerosol influence Figure (left): time series for the comparison of tropospheric NO2 from the UV and vis instruments for Sep 2006. (right): correlation plot for the same data set. Figure (top): time series of MAXDOAS and SCIAMACHY tropospheric vertical columns of NO2 for DANDELIONS-II. (bottom): scatterplot for both campaigns in 2005 and 2006. The correlation of 0.72 shows good agreement, differences can be understood from above reasoning. The SCIAMACHY datapoints from distances >50km show larger variations. The results from the two instruments agree quite well with a correlation of 0.89, the UV instrument showing slightly higher NO2 values than the Vis instrument. The differences show the influence of the retrieval settings and assumptions. In the following, results from the Vis instrument are used. NO2 profiles HCHO at Cabauw From MAXDOAS measurements, NO2 profile information is retrieved with BREAM (Bremian Advanced MAXDOAS Retrieval Algorithm): From the MAXDOAS measurements, also tropospheric formaldehyde (HCHO) columns are retrieved. Comparison of HCHO and NO2 can be used as a measure for air pollution sources. For anthropogenic sources, tropospheric NO2 prevails. In Cabauw, varying situations occur. On some days, HCHO values exceed NO2, on others the situation is vice versa. This clearly indicates different sources for the two gases. In the mean, for September 2006, tropospheric amounts of both trace gases are similar (with vertical columns of 1.3.1016 molec/cm2). • for a chosen time period, the NO2 profile at the measurement site is calculated • measured slant columns from the different MAXDOAS viewing angles are used • includes radiative transfer calculations from the SCIATRAN code • for calculations of the aerosol amount, the retrieved O4 amount is used • comparison of retrieved surface concentrations with in situ NO2 monitor is possible Figure (below): time series of NO2 and HCHO for the DANDELIONS-II campaign. Figure (below): Surface concentration and mixing ratio of NO2 from MAXDOAS and in situ measurements Figure (right): typical fit result for HCHO on Sep 13 in Cabauw. Figure (above): NO2 profiles on Sep 13 for different times. The highest values are found close to the ground rapidly decreasing with height as expected from the strong split-up in NO2 slant columns with viewing angle. Figures (above): Comparison of HCHO (left) and NO2 (right) slant columns at Cabauw on Sep 13 from MAXDOAS measurements. Both trace gases show clear splitting-up of the slant column values for the different viewing angles (30° and 0° to 16° scans), typical for tropospheric trace gases. The splitting is less for HCHO, so the profile is less pronounced towards the surface. Figure (above): Daily variation of the NO2 profile on Sep 13. The ground layer with the highest NO2 values increases towards midday. Acknowledgements Conclusions • Measurements of tropospheric NO2 from different MAXDOAS instruments at the DANDELIONS campaigns show good intercomparison results and were used for validation of SCIAMACHY data. • NO2 profiles show highest values close to the ground and allow comparison with measurements from a ground-based in situ NO2 monitor. • Formaldehyde column amounts lie in the same range as the NO2 values in September 2006. On some days NO2 prevails, on others HCHO, clearly showing different sources. • Further comparisons of MAXDOAS results with NO2 LIDAR profiles and in situ measurements at 200 m altitude will follow shortly. • Collaboration with all DANDELIONS participants is gratefully acknowledged. • Parts of the project have been funded by the University of Bremen and the ACCENT network. Selected References • F. Wittrock, H. Oetjen, A. Richter, S. Fietkau, T. Medeke, A. Rozanov, and J. P. Burrows: MAX-DOAS measurements of atmospheric trace gases in Ny-Ålesund - Radiative transfer studies and their application, Atmos. Chem. Phys. 4, 955-966, 2004. • A. Heckel, A. Richter, T. Tarsu, F. Wittrock, C. Hak, I. Pundt, W. Junkermann, and J. P. Burrows: MAX-DOAS measurements of formaldehyde in the Po-Valley, Atmos. Chem. Phys. Discuss. 4, 1151–1180, 2004. • A. Rozanov, V. V. Rozanov, and J. P. Burrows: A numerical radiative transfermodel for a spherical planetary atmosphere: combined differential-integral approach involving the Picard iterative approximation, J. Quant. Spectrosc. Radiat. Transfer 69, 491, 2001. • E. Brinksma et al.: NO2 and aerosol validation during the 2005 and 2006 DANDELIONS campaigns, JGR, to be published. • Campaign website: http://www.knmi.nl/omi/research/validation/dandelions