Download
1 / 16
170 likes | 310 Views
Use of the Fama-French Three-Factor Model by Nevada PUC Staff. By Ron Knecht Economist, Nevada PUC Staff For Society of Utility and Regulatory Financial Analysts (SURFA) – 17 April 2009. Agenda. RK’s Utility COC Modeling Morningstar/Ibbotson FF3F Data M/I’s Discussion of FF3F & CAPM

E N D
Use of the Fama-French Three-Factor Modelby Nevada PUC Staff By Ron Knecht Economist, Nevada PUC Staff For Society of Utility and Regulatory Financial Analysts (SURFA) – 17 April 2009 Ron Knecht's FF3F Presentation to SURFA 17 April 2009
Agenda • RK’s Utility COC Modeling • Morningstar/Ibbotson FF3F Data • M/I’s Discussion of FF3F & CAPM • M/I’s Conclusion on FF3F • Utility Sector Results Using 7 Models w/ M/I Rf & Expected Inflation Values • FPL & OGE Results Using 7 Models w/ M/I Rf & Expected Inflation Values • Conclusions Ron Knecht's FF3F Presentation to SURFA 17 April 2009
RK’s Utility COC Modeling • Full range of ROE models employed, based on economic & legal standards: • 7 primary models: 2 DCFs, CA+I, 4 (C)APMs (VL, M/IDecile, ECAPM & FF3F) • Dozens of other model results estimated and tested • Rigorous model implementation/detailing (3-stage DCFs, range of (C)APMs, etc.) with wide range of data sources & close attention to data issues • All models run for each of 72 electric, gas & water utilities for which data are reasonably available.Results tested to learn whether use of screening variables and limited sets of comparable firms is empirically justified; finding no empirical basis, I rely on primary-set averages from utility universe. • Adherence to Modigliani-Miller principles: Estimated ROE tied directly to industry-average capital structure & tailored to other capital structures via ATWACC • Ancillary issues, such as issuance and flotation costs, are addressed • Reasonableness of results and possible pitfalls are considered expressly – but until 2009, I found no reason not to rely on the modeling results. Ron Knecht's FF3F Presentation to SURFA 17 April 2009
Morningstar/Ibbotson FF3F Data 1 • FF3F Model stated by M/I as: E(Ri) - Rf = βm*RPm + βs*RPs + βv*RPv where: E(Ri) = expected return on security i Rf = rate on risk-free asset βm = market coefficient in the FF regression (FFR) RPm = expected market risk premium βs = small-minus-big (SMB) coefficient in the FFR RPs = expected SMB risk premium βv = high-minus-low (HML) coefficient in the FFR RPv = expected HML risk premium Ron Knecht's FF3F Presentation to SURFA 17 April 2009
Morningstar/Ibbotson FF3F Data 2 • RPs is “estimated as the difference between the historical average annual returns on the small-capitalization and large-capitalization portfolios” • RPv is “estimated as the difference between the historical average annual returns on the high book-to-market stocks and the low book-to-market stocks” • HML portfolios require financial statement data, which is taken from Compustat and extends back to 1962 • HML and SMB portfolios formed using stocks from NYSE, AMEX and NASDAQ. Ron Knecht's FF3F Presentation to SURFA 17 April 2009
Morningstar/Ibbotson FF3F Data 3 • To form SMB portfolios, stocks are sorted into two groups: market value bigger than median for NYSE and less; so, more small firms • To form HML portfolios, stocks are sorted into three groups by B/M, corresponding to top 30%, middle 40% and bottom 30% using NYSE breakpoints • FF form portfolios annually using data July-June Ron Knecht's FF3F Presentation to SURFA 17 April 2009
Morningstar/Ibbotson FF3F Data 4 • From 2 size portfolios & 3 M/B portfolios, FF create 6 capitalization-weighted return series: • Small size and low B/M • Small size and medium B/M • Small size and high B/M • Big size and low B/M • Big size and medium B/M • Big size and high B/M Ron Knecht's FF3F Presentation to SURFA 17 April 2009
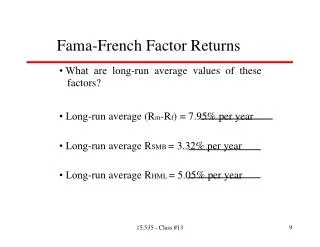
Morningstar/Ibbotson FF3F Data 5 • SMB is average monthly return of three small size-oriented portfolios, less the average monthly returns on the three big size-oriented portfolios, currently estimated at 3.14% • HML is difference between average returns on the two high M/B portfolios and average returns on two low M/B portfolios, currently estimated at 4.17% • To present the data, M/I’s Beta Book (two annual editions – data through June & December) displays the product of the regression coefficient for each factor and the factor itself – i.e., an SMB premium and HML premium for each stock, as well as a β value for each firm and Rf and MRP values it provides in its publications, allowing easy computation (and M/I provide t-statistics and R2 for each set). Ron Knecht's FF3F Presentation to SURFA 17 April 2009
M/I’s Discussion of FF3F & CAPM 1 • M/I displays a graph comparing estimates using its CAPM, size-adjusted CAPM and FF3F data for the firms in its population. • The graph shows the CAPM results as almost normal with a long tail to the right, the size-adjusted CAPM estimates as a variation slightly shifted to the right (positive skewness), and the FF3F ROEs as an even more right-shifted and flatter distribution (even more positive skewness). None of these results are surprising. • However, M/I notes: “What is surprising about the Fama-French cost of equity distribution … is the number of companies with very high costs of equity”, including a number above a 30% ROE. M/I concludes: “It may be that the Fama-French model over-corrects for size and/or distress in the time period covered.” Ron Knecht's FF3F Presentation to SURFA 17 April 2009
M/I’s Discussion of FF3F & CAPM 2 • M/I also discusses at some length stability issues for FF3F. Its graphs illustrate vividly that, while FF3F and CAPM ROE estimates are stable and nearly identical over time for the largest firms taken as a group, those for the smallest firms as a group are much less stable for both models and, of course, much higher for the FF3F model. • M/I notes; “These are not unanticipated results. As more factors are added to the analysis, less stability is also added because a change in any of the three factors can have an impact on the cost of equity produced by the model.” • In fact, the FF3F ROE estimates for the decile of smallest firms are given to sudden excursions of as much as 50% over brief periods. Ron Knecht's FF3F Presentation to SURFA 17 April 2009
M/I’s Discussion of FF3F & CAPM 3 • M/I adds: “On a company-specific basis, the CAPM model also tends to produce results that appear more stable than Fama-French.” And it illustrates this with graphs for three firms. • Company-specific results show that the ROEs estimated by the two models tend to move together over time, although they may remain far apart, converge or even cross. • In a few cases, the FF3F results can be more stable over time than are the CAPM estimates. Ron Knecht's FF3F Presentation to SURFA 17 April 2009
M/I’s Conclusion on FF3F • “The Fama-French Model provides a different approach to calculating the cost of equity. It is not possible to say whether the numbers provided by the Fama-French model are better or more reliable than the cost of equity estimates provided by the CAPM. Both models fail to produce logical results for a large number of entities. The Fama-French model should be viewed as an additional tool available to analysts in determining the cost of equity.” Ron Knecht's FF3F Presentation to SURFA 17 April 2009
Utility Sector Results Using 7 Models w/ M/I Rf & Expected Inflation Values Method 4Q07 1Q08 4Q08 DCF3S / VLDivG 9.67 10.09 9.42 DCF3S / G=r*b+v*s 9.05 9.62 8.60 CA+I Risk Prem. 11.36 11.25 7.15 VL Blume CAPM 9.62 9.24 6.99 I/M Decile CAPM 10.17 9.89 7.37 I/M Decile ECAPM 10.55 10.45 7.89 Fama-French 3F 10.65 10.37 5.87 Average of 7 10.15 10.14 7.61 Debt Ratio 50.12 49.89 50.45 Equity Ratio 49.88 50.11 49.55 Note: The 4Q08 values are not reasonable because the Rf = 3.03% and expected inflation = 0.60% are not credible in my view. These values were used for consistency of method and data sources. Ron Knecht's FF3F Presentation to SURFA 17 April 2009
FPL Results Using 7 Models w/ M/IRf & Expected Inflation Values Method 4Q07 1Q08 4Q08 DCF3S / VLDivG 9.77 9.08 8.19 DCF3S / G=r*b+v*s 8.15 8.55 7.59 CA+I Risk Prem. 10.38 10.18 6.66 VL Blume CAPM 8.71 8.51 7.05 I/M Decile CAPM 6.89 6.69 5.68 I/M Decile ECAPM 7.66 7.66 6.19 Fama-French 3F 7.49 7.29 3.71 Average of 7 8.44 8.28 6.44 Debt Ratio 49 49 52 Equity Ratio 51 51 48 Note: The 4Q08 values are not reasonable because the Rf = 3.03% and expected inflation = 0.60% are not credible in my view. These values were used for consistency of method and data sources. Ron Knecht's FF3F Presentation to SURFA 17 April 2009
OGE Results Using 7 Models w/ M/IRf & Expected Inflation Values Method 4Q07 1Q08 4Q08 DCF3S / VLDivG 9.23 9.83 9.70 DCF3S / G=r*b+v*s 9.16 9.83 9.23 CA+I Risk Prem. 15.05 14.85 10.84 VL Blume CAPM 9.27 8.79 6.80 I/M Decile CAPM 9.57 9.37 8.23 I/M Decile ECAPM 10.12 10.12 8.58 Fama-French 3F 10.71 10.51 6.95 Average of 7 10.44 10.47 8.62 Debt Ratio 46 46 53 Equity Ratio 54 54 47 Note: The 4Q08 values are not reasonable because the Rf = 3.03% and expected inflation = 0.60% are not credible in my view. These values were used for consistency of method and data sources. Ron Knecht's FF3F Presentation to SURFA 17 April 2009
Conclusions • The previous three tables and the next one show the volatility of the FF3F ROEs – this last (very unusual) year greater than that for any other method. • This year’s results undercut the claim that FF3F estimates are unduly high for utilities, due to regulation allegedly keeping their B/M ratios high. Utility stock prices have fallen less than those for other industries (restraining B/M’s rise), but their HML premia and FF3F ROE estimates have collapsed. • Turning to the factors, the next page shows that CAPM and FF3F betas do not differ systematically. The notable t-stat difference is that the HML t-stat absolute values were very high a year ago, but are only slightly higher than other t-stats now. The collapse of utility SMB and HML premia over the last year drives the collapse of FF3F ROEs. • R2 values for the FF3F are modestly higher than for the CAPM, indicating slightly more explanatory power. However, events of the last year indicate that benefit has diminished even further at the present time. • Overall, I continue to subscribe to the M/I conclusion that FF3F is another tool available to COC analysts. All of our tools are being tested by events of the last year, so it would be unwise to throw any of them away. Ron Knecht's FF3F Presentation to SURFA 17 April 2009