Genetic Expression of Disease Resistance in Hyg(+) and Hyg(-) Plant Lines
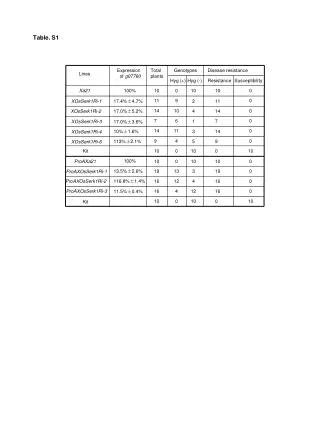
This study analyzed the disease resistance levels of various plant genotypes expressing resistance genes Xa21 and XOsSerk1Ri under different conditions. Results show varying levels of resistance and susceptibility in total plants tested, with detailed data presented in the table.

Genetic Expression of Disease Resistance in Hyg(+) and Hyg(-) Plant Lines
E N D
Presentation Transcript
Expression of g07760 Total plants Genotypes Disease resistance Lines Hyg (+) Hyg (-) Resistance Susceptibility Xa21 100% 10 0 10 10 0 11 9 0 XOsSerk1Ri-1 17.4%±4.7% 2 11 14 10 0 XOsSerk1Ri-2 17.0%±5.2% 4 14 7 6 0 1 7 XOsSerk1Ri-3 17.0%±3.6% 14 11 0 10%±1.6% 3 14 XOsSerk1Ri-4 9 4 0 113%±2.1% 5 9 XOsSerk1Ri-6 Kit 10 0 10 0 10 100% ProAXa21 10 0 10 10 0 13.5%±2.6% 19 13 3 19 0 ProAXOsSerk1Ri-1 ProAXOsSerk1Ri-2 116.8%±1.4% 16 12 4 16 0 ProAXOsSerk1Ri-3 11.5%±0.4% 16 4 12 16 0 10 0 10 0 10 Kit Table. S1 B