Download
1 / 14
140 likes | 258 Views
Set up your next blank notebook page as shown below. CW #9 : MAKING DATA TABLES AND GRAPHS Part A: Teacher Example Problem: Data and Results: ( leave at least 8 lines to write your Data table) Graph. Step 1: figure

E N D
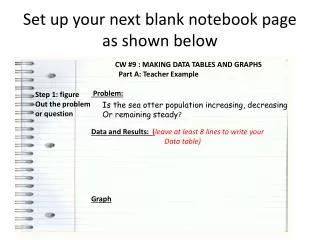
Set up your next blank notebook page as shown below CW #9 : MAKING DATA TABLES AND GRAPHS Part A: Teacher Example Problem: Data and Results: (leave at least 8 lines to write your Data table) Graph Step 1: figure Out the problem or question Is the sea otter population increasing, decreasing Or remaining steady?
CW #9 : MAKING DATA TABLES AND GRAPHS Part A: Sea Otters Problem: Is the sea otter population increasing, decreasing or remaining steady? Step 1: figure Out the problem or question
In year one of the study (1962) they counted 46 otters. Eight years later the count was 42. In 1982 the count was 35. Ten years later it dropped to 30. At last count in 2002, the count of was 26. CW #9 : MAKING DATA TABLES AND GRAPHS Part A: Sea Otters Problem: Is the sea otter population increasing, decreasing or remaining steady? Step 1: figure Out the problem or question Data And Results Step 2: Record your observations
CW #9 : MAKING DATA TABLES AND GRAPHS Part A: Sea Otters Problem: What happened to the Sea Otter Population? Step 1: figure Out the problem or question Step 2: Record your observations Data and results Step 3: Organize the observations (data) into a table year Number of otters
CW #9 : MAKING DATA TABLES AND GRAPHS Part A: Sea Otters Problem: Is the sea otter population increasing, decreasing or remaining steady? Step 1: figure Out the problem or question In year one of the study (1962) they counted 46 otters. Eight years later the count was 42. In 1982 the count was 35. Ten years later it dropped to 30. At last count in 2002, the count of was 26. Step 2: Record your observations Data and Results Step 3: Organize the observations (data) into a table Number of otters year 1962 46
CW #9 : MAKING DATA TABLES AND GRAPHS Part A: Sea Otters Problem: Is the sea otter population increasing, decreasing or remaining steady? Step 1: figure Out the problem or question In year one of the study (1962) they counted 46 otters. Eight years later the count was 42. In 1982 the count was 35. Ten years later it dropped to 30. At last count in 2002, the count of was 26. Step 2: Record your observations Data and Results year Number of otters 1962 46 1970 42 35 30 2002 26 Step 3: Organize the observations (data) into a table Manipulated variable: the variable you are changing on purpose To see what will happen. Time is often the manipulated variable
CW #9 : MAKING DATA TABLES AND GRAPHS Part A: Sea Otters Problem: Is the sea otter population increasing, decreasing or remaining steady? Step 1: figure Out the problem or question In year one of the study (1962) they counted 46 otters. Eight years later the count was 42. In 1982 the count was 35. Ten years later it dropped to 30. At last count in 2002, the count of was 26. Step 2: Record your observations Data and Results Responding variable: The variable that changes in response to the manipulated variable. It is what you are measuring year Number of otters 1962 46 1970 42 35 30 2002 26 Step 3: Organize the observations (data) into a table Manipulated variable: the variable you are changing on purpose To see what will happen. Time is often the manipulated variable
CW #9~ Making Data Tables and Graphs SEA OTTERS: TEACHER EXAMPLE Problem:Is the sea otter population increasing, decreasing Or remaining steady? Data & Results: DATA TABLE #1: Change in Sea Otter Pop. over 40 years GRAPH: GRAPH#1: Change in Sea Otter Population over 40 years # of otters YEARS
YOUR TASK • PARTNER A -Read HANGING WEIGHTS -DIRECT PARTNER B to Create data table ON WHITEBOARD -CHECK YOUR DATA TABLE AGAINST YOUR “CRITERIA FOR CONSTRUCTING A DATA TABLE” FOUND IN YOUR SCIENCE NOTEBOOK -Get checked by teacher -Copy DATA TABLE Science Notebook -Create Graph ON WHITEBOARD CHECK YOUR GRAPH AGAINST YOUR “CRITERIA FOR CONSTRUCTING A GRAPH” FOUND IN YOUR SCIENCE NOTEBOOK (APPENDIX Pg. H) -Get checked by teacher before proceeding -Copy GRAPH Science Notebook • PARTNER B - ask questions and offer suggestions • Switch roles for BOUNCING SPHERICAL OBJECTS
CW #9~ Making Data Tables and Graphs • HANGING WEIGHTS: PARTNER A Problem: Data & Results: DATA TABLE: GRAPH:
CW #9~ Making Data Tables and Graphs • BOUNCING SPHERICAL OBJECTS: PARTNER B Problem: Data & Results: DATA TABLE: GRAPH:
CW #9~ Making Data Tables and Graphs • HANGING WEIGHTS: PARTNER A Problem: Does the number of objects hanging from the spring increase the length of the spring? Data & Results: DATA TABLE: GRAPH:
CW #9~ Making Data Tables and Graphs • BOUNCING SPHERICAL OBJECTS: PARTNER B Problem: Does the height at which the ball is dropped affect how high it bounces? Data & Results: DATA TABLE: GRAPH:


![[PDF]❤READ⚡ Blank Recipe Book: Blank recipe book to write in your own recip](https://cdn7.slideserve.com/13204690/blank-recipe-book-blank-recipe-book-to-write-dt.jpg)