Download
1 / 17
170 likes | 291 Views
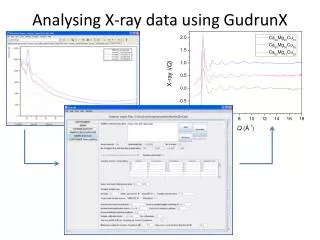
Analysing Microarray Data Using Bayesian Network Learning. Name: Phirun Son Supervisor: Dr. Lin Liu. Contents. Aims Microarrays Bayesian Networks Classification Methodology Results. Aims and Goals. Investigate suitability of Bayesian Networks for analysis of Microarray data

E N D
Analysing Microarray Data Using Bayesian Network Learning Name: Phirun Son Supervisor: Dr. Lin Liu
Contents • Aims • Microarrays • Bayesian Networks • Classification • Methodology • Results
Aims and Goals • Investigate suitability of Bayesian Networks for analysis of Microarray data • Apply Bayesian learning on Microarray data for classification • Comparison with other classification techniques
Microarrays • Array of microscopic dots representing gene expression levels • Gene expression is the process of DNA genes being transcribed into RNA • Short sections of genes attached to a surface such as glass or silicon • Treated with dyes to obtain expression level
Challenges of Microarray Data • Very large number of variables, low number of samples • Data is noisy and incomplete • Standardisation of data format • MGED – MIAME, MAGE-ML, MAGE-TAB • ArrayExpress, GEO, CIBEX
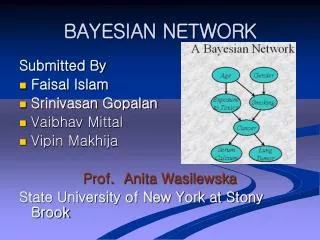
Bayesian Networks • Represents conditional independencies of random variables • Two components: • Directed Acyclic Graph (DAG) • Probability Table
Methodology • Create a program to test accuracy of classification • Written in MATLAB using Bayes Net Toolbox (Murphy, 2001), and Structure Learning Package (Leray, 2004) • Uses Naive network structure, K2 structure learning, and pre-determined structure • Test program on synthetic data • Test program using real data • Comparison of Bayes Net and Decision Tree
Synthetic Data • Data created from well-known Bayesian Network examples • Asia network, car network, and alarm network • Samples generated from each network • Tested with naive, pre-known structure, and with structure learning
Synthetic Data - Results 50 Samples, 10 Folds, 100 Iterations Class Node: Dyspnoea 100 Samples, 10 Folds, 50 Iterations Class Node: Dyspnoea Asia Network Lauritzen and Spiegelhalter, ‘Local Computations with Probabilities on Graphical Structures and Their Application to Expert Systems’, 1988, pg 164
Synthetic Data - Results 50 Samples, 10 Folds, 100 Iterations Class Node: Engine Starts 100 Samples, 10 Folds, 50 Iterations Class Node: Engine Starts Car Network Heckerman, et al, ‘Troubleshooting under Uncertainty’, 1994 pg 13
Synthetic Data - Results 50 Samples, 10 Folds, 10 Iterations Class Node: InsufAnesth ALARM Network 37 Nodes, 46 Connections Beinlich et al, ‘The ALARM monitoring system: A case study with two probabilistic inference techniques for belief networks’, 1989 50 Samples, 10 Folds, 10 Iterations Class Node: Hypovolemia
Lung Cancer Data Set • Publically available data sets: • Harvard: Bhattacharjee et al, ‘Classification of Human Lung Carcinomas by mRNA Expression Profiling Reveals Distinct Adenocarcinoma Subclasses’, 2001 • 11,657 attributes, 156 instances, Affymetrix • Michigan: Beer et al, ‘Gene-Expression Profiles Predict Survival of Patients with Lung Adenocarcinoma’, 2002 • 6,357 attributes, 96 instances, Affymetrix • Stanford: Garber et al, ‘Diversity of Gene Expression in Adenocarcinoma of the Lung’, 2001 • 11,985 attributes, 46 instances, cDNA • Contains missing values
Feature Selection • Li (2009) provides a feature-selected set of 90 attributes • Using WEKA feature selection • Also allows comparison with Decision Tree based classification • Discretised data in 3 forms • Undetermined values left unknown • Undetermined values put into either category – two category • Undetermined values put into another category – three category • WEKA: Ian H. Witten and Eibe Frank, ‘Data Mining: Practical machine learning tools and techniques’, 2005.
Harvard Set • Harvard Training on Michigan • Harvard Training on Stanford
Michigan Set • Michigan Training on Harvard • Michigan Training on Stanford
Stanford Set • Stanford Training on Harvard • Stanford Training on Michigan
Future Work • Use structure learning for Bayesian Classifiers • Increase of homogeneous data • Other methods of classification