Definition of E.D.
500 likes | 856 Views
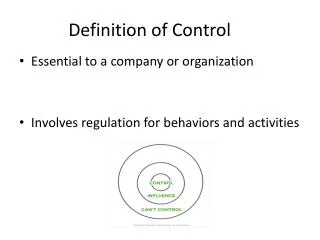
Definition of E.D. E.D. is the process of: Creating good jobs. Attracting investment to a community Striving for long-term stability. Old Economy vs.New Economy. In the Old Economy, growth typically was associated with degradation of the environment and quality of life.

Definition of E.D.
E N D
Presentation Transcript
Definition of E.D. • E.D. is the process of: • Creating good jobs • Attracting investmentto a community • Striving for long-term stability
Old Economy vs.New Economy • In the Old Economy, growth typically was associated with degradation of the environment and quality of life. • The cleaner nature of the New Economy makes it possible to locate homes, workplaces and recreational areas closer together. • The New Economy thrives on change, yet wants certainty that quality of life and the natural environment will be preserved. • The New Economy is knowledge-based and therefore places a higher value on people.
Economic Development Strategies • Workforce Development • Infrastructure Development • Business Development • Tourism Development • Organizational Development
Measures of Economic Activity • Demographic trends and forecasts • Construction and employment trends • Retail and service sector sales • Property values
Dane County Labor Force 1990 2003 Employed 212,610 286,721 Labor Force 217,063 295,456 % Unemployed 2.1 3.0 Source: Wisconsin Department of Workforce Development
36.7% 30.0% Labor Force Dane County Jobs Job & Labor Force Growth 1990– 2002 Source: Wisconsin Department of Workforce Development
25.4 23.9 17.5 15.9 14.8 12.9 12.6 1950 1960 1970 1980 1990 2000 2002 Demographic Trend:Lower Birth Rates – Wisconsin Births Per 1,000 Total Population Source: Wisconsin Department of Health & Family Services
Prior to 1990 1990 – 2000 45% Natural increase 35% Migration 55% Migration 65% Natural increase Demographic Trend:Shift in Population Growth
Demographic Trend:Changing Population Minorities represent: • 12.6% of Dane County’s population • Nearly 1 in 5 Madison residents
47.3 44.7 42.3 41.0 39.3 38.5 37.4 36.0 36.3 34.4 Wisconsin Dane County Rock County MarquetteCounty AdamsCounty 2000 2020 (projected) Demographic Trend:Aging Workforce (Avg. Age) Source: Department of Workforce Development
Attracting the “Creative Class” • Madison ranking: Most Creative Small City in U.S. • Comprise 30% of workforce nationally • Earn nearly double the traditional working class, on average
Next Generation Communities • Gen-X’ers first to focus on location vs. job • “Cool” communities offer: • Healthy living • Affordable lifestyle • “After-hours” activities • Ability to “get around” town
510,155 426,526 367,085 Other Cities 222,095 Villages / Towns Madison 1960 1990 2000 2020 projected Dane County Population Source: Dane County Regional Planning Commission
Stoughton Monona 41 – 50% 51 – 60% 61 – 70% 259% -7% 1 – 10% 11 – 20% 21 – 30% 31 – 40% DeForest Waunakee Madison Middleton Oregon Cottage Grove McFarland Fitchburg Verona Cross Plains Sun PrairieMt. Horeb Community Population Growth 1990 – 2000 (Dane County Average 16.2%)
14% Rural 49% Madison 37% Suburbs Shift in Where People Live Source: Dane County Regional Planning Commission
91% 44% 39% Median Household Income Median Home Value Median Gross Rent Change in Income and Housing Costs 1989 – 1999 Source: Census 2000
Per Capita Income – 2001 • United States $30,413 • Wisconsin $29,196 • Minnesota $33,059 • Illinois $32,990 • Dane Co. $36,201 Source: U.S. Bureau of Economic Analysis, 2001
Average (Mean) Home Sale Price By County Dane $228,408 Sauk $157,788 Columbia $157,249 Green $140,654 Dodge $126,822 Rock $119,739 Source: South Central Wisconsin MLS, 3rd Quarter 2003
60/40 Mismatch • Madison generates: • 60% of new jobs in Dane County • 40% of population growth
23,828 16,425 7,828 4,994 1970 1980 1990 2000 Net Commuters into Dane County Source: Dane County Regional Planning Commission, Census 2000
7,348 County Columbia 3,111 Green Rock 3,001 2,227 Iowa 1,881 Sauk Net Commuters into Dane County Source: Wisconsin Department of Workforce Development and Census, 2000
38% Services 24% Retail Trade 13% Fin’l. (FIRE) 11% Construction 5% Manufacturing 5% Wholesale Trade 3% Trans. / Utilities 1% Other Dane County Firms by Industry Source: U.S. Bureau of Census, 2001
Government 1 out of 4 Government 1 out of 3 1970 2002 – 2022 Public-Sector Jobs Declining Dane County Jobs
Employees 67% 0 – 9 15% 10 – 19 11% 20 – 49 4% 50 – 99 3% 100+ Dane County Firms by Employment Source: U.S. Bureau of Census, 2001
Future Job Growth • Small businesses: • Create 75% of new jobs • Contribute 70% of all economic growth Sources: U.S. Small Business Administration, Global Entrepreneurship Monitor
% of Private Sector Employment Payroll Services 37% 39% Retail Trade 24% 12% FIRE 13% 17% Manufacturing 12% 13% Construction 7% 9% Wholesale Trade 5% 7% Trans. / Utilities 2% 3% Quality of Jobs Source: U.S. Bureau of the Census, 2001
578 568 526 $525 520 514 $459 $460 $405 $400 1998 1999 2000 2001 2002 Investment in $ millions Number of projects Non-Residential Construction
$748.0 Office $689.2 Institutional $456.9 Retail $148.6 Manufacturing $122.3 Warehouse/Dist. Other Dane County Cities $84.5 Hotel Madison Non-Residential Construction 1998 – 2002 (In Millions) Source: MGE Construction Activity Report
1987 2003 Total # of Parks12 55 Dane County Business Parks # in Madison 5 20 # in Other Communities 7 35
Investment (millions) % of Dane Co. Total Madison $1,687 74.6% Middleton 230.1 10.2% Fitchburg 139.8 6.2% Verona, StoughtonWaunakee 95.5 4.5% Sun Prairie 87.0 4.0% DeForest 64.2 3.0% Non-Residential Construction 1998 – 2002 Source: MGE Construction Activity Report
303,100 221,700 1990 2002 Job Growth in Dane County
Industry Net Change Services 12,100 Government 3,100 FIRE 2,300 Trans. / Utilities 600 Manufacturing -1,500 Retail Trade 1,500 Construction 1,900 Wholesale Trade 800 Job Growth in Dane County 20,800 Net Gain in Jobs, 1998 – 2002 Source: Wisconsin Department of Workforce Development
% ChangeJan. 2002 – Oct. 2003 Oct. 2003 Dane Co. 29,200 8.6% Wisconsin 509,500 (4.2%) Manufacturing Jobs Source: Wisconsin Department of Workforce Development
% of Private Sector Firms 662 5.3% Jobs 27,226 12.7% Private-SectorWages Reported $1.14 billion 15.8% Economic Impact of Manufacturing Dane County 2002 Source: Wisconsin Department of Workforce Development, 2003
10.0% 2.5% Overall Employment High-Tech Employment High-Tech Employment Dane County Annual Growth, 1997 – 2002 Source: MGE Greater Madison Area Directory of High-Tech Companies, 2003
136.0% 36.7% 30.0% Labor Force Dane County Jobs High-Tech Jobs High-Tech Job Growth 1990– 2002 Source: Wisconsin Department of Workforce Development
$6.3 $3.8 1995 2002 City of Madison Room Tax In Millions
$1 billion $570 million 1997 2002 Visitor Spending in Dane County Source: Economic Impact of Expenditures by Travelers in Dane County
Building on Success:Maintaining a Competitive Edge • Anticipate / adjust / respond to change • Cooperate / collaborate • Build state-of-the-art infrastructure • Streamline taxes & regulations • Preserve quality of life