Using Spread Chart from the Pairs Trading Station in MetaTrader
40 likes | 47 Views
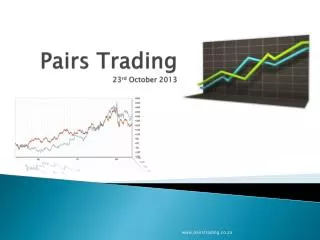
From Pairs Trading Station in MetaTrader version, you can access the Spread Chart, which is mathematically processed to show the distance between two financial instruments (or between two assets).<br><br>You can access the Spread Chart by clicking << button or >> button near the Spread button.<br><br>Here is the brief guide on how to interpret the Spread Chart. In this example, we use AUDUSD and XAUUSD as asset 1 and asset 2. The absolute magnitude of these two assets are compared in the normalized sense to compare apple to apple and pear to pear. Two cases exist including the positive spread and negati
Download Presentation 
Using Spread Chart from the Pairs Trading Station in MetaTrader
An Image/Link below is provided (as is) to download presentation
Download Policy: Content on the Website is provided to you AS IS for your information and personal use and may not be sold / licensed / shared on other websites without getting consent from its author.
Content is provided to you AS IS for your information and personal use only.
Download presentation by click this link.
While downloading, if for some reason you are not able to download a presentation, the publisher may have deleted the file from their server.
During download, if you can't get a presentation, the file might be deleted by the publisher.
E N D
Presentation Transcript


More Related