Download
1 / 18
180 likes | 223 Views
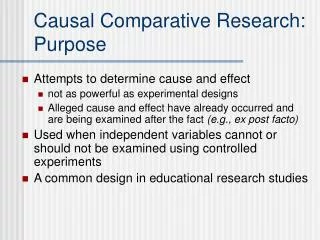
Investigating similarities between natural and random causal graphs, analyzing triangles and cliques, and testing for power law distribution and path metrics.

E N D
Comparative Analysis of Constructed and Random DAGs for Automated Causal Discovery Searching for Patterns in How We Search for Causality December 13, 2017 Colin Shea-Blymyer, Vartan Kesiz-Abnousi
Outline • Introduction • Motivation • Problem • Data • Process/Results • Conclusion
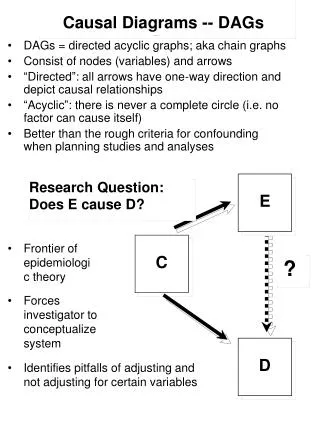
Introduction Rain Causal inference - Statistical approach; determines causal relationships. Causal graph - Graph representation of causal relationships. Directed Acyclic Graph - Graph with directed edges, and contains no cycles. Poor Visibility House Lights Wet Streets Car Accident
Motivation Causal Graphs in the Wild:Causal Inference in Econometrics by Van-Nam, et al. Statistical Causal Inferences and Their Applications in Public Health Research by He, et al. Causal Graph-Based Analysis of Genome-Wide Association Data in Rheumatoid Arthritis by Alekseyenko, et al. Our Questions: Do such graphs share structural properties? Is this an effect of the algorithms at work, or the natural structure of causal relationships? How easily can these structures be replicated by random graph models? Can we tune causal graphs using these random graphs? Is natural causal structure like any simple model? Are these properties present in probabilistic graphs? Acyclic natural networks? How different are causal graphs from probabilistic graphs, or natural networks?
Problem: Causal DAG a Mathematical Formulation Causal Directed Acyclic Graph A causal DAG is an ordered pair G(V, E), where V is the set of vertices and E the set of edges. Causal relationships require a formal definition of the probabilistic structure structure of the graph. The joint distribution is formulated as: We can infer about the probability of C occurring, conditional to A. Formally:
Data • 4 causal graphs based on f-MRI data generated using FGES for A million variables… by Ramsey et al. • DAG_4 - 3.35 MB, 47600 vertices, 127000 edges, most rigorous search • DAG_10 - 1.29 MB, 26700 vertices, 40000 edges • DAG_20 - 0.72 MB, 14000 vertices, 16500 edges • DAG_40 - 0.47 MB, 5700 vertices, 5800 edges, least rigorous search • 1 Bayesian network based on physiological data for Computer-aided electromyography. • MUNIN - 1.02 MB, 1000 vertices, 1400 edges • 1 citation network among patents from 1963 to 1999. • patentcite - 244.42 MB, 16.52 Million vertices, 2.77 Million Edges • 4 randomly generated graphs • Erdos-Renyi - 1000 vertices, 770 edges • Power-Law - 1000 Vertices, 1080 edges • Barabasi - 1000 Vertices, 770 edges • unifDAG - uniformly sampled from space of DAGs, 1000 vertices, 271000 edges
Process: Features of Interest • Triangles • Triangle-Faithfulness Assumption: some algorithms assume the faithfulness in a triangle will not be violated. • The fewer triangles present, the safer this assumption is. • Cliques • Triangle-Faithfulness Assumption. • This assumption might be safer in smaller cliques. • Degree Distribution • Some causal inference algorithms prefer sparse graphs. • Scale-free ground truth may be difficult to model.
Results: Triangles • Causal graphs with triangles have a very low ratio of triangles to edges. • UnifDAG has a ratio that is an order of magnitude larger. • Patentcite has a ratio that is two orders of magnitude larger. As causal inference algorithms discover relatively few triangles, triangle-faithfulness may be safe to assume.
Results: Cliques • MUNIN and the causal graphs tend toward small maximal clique sizes. • These graphs display a ratio of cliques to edges that is nearly 1:1. • Patentcite has a max clique size that is almost 3x larger than the largest causal graph’s max clique size. • Patentcite has a ratio of cliques to edges that is more than 5x larger than any other. Is this because causal models are sparse, or a property of natural causal structure?Triangle-faithfulness should be safe in this context.
Process: Causality Test D-separation test: The "d" in d-separation and d-connection stands for dependence G is a directed graph in which X, Y and Z are disjoint sets of vertices X and Y are d-separated by Z in G if and only if they are not d-connected by Z in G. Formulation:
Process: Power Law Test Does the Empirical and Generated Data follow the Power Law? Utilize the non-parametric Kolmogorov-Smirnov Statistic the empirical datasets "Data 4 and "patentcite" follow the Power Law for α 10%
Results: Path Metrics Causal graphs... • Maintain large diameters • Maintain large mean in-degree eccentricity • Display low clustering coefficients Uniformly Random DAGs… • Display enormous ratios of edges to vertices • (Consequently) has enormous mean in-degree, density, clustering coefficient, and degree distribution power exponent
Results: Eccentricity Distributions DAG_10 DAG_4
Conclusion Our analysis discovered some unique trends among the causal graphs in our study: 1) small ratios of triangles to edge count, 2) strictly structured cliques, 3) power-law distributions unlike any modeled by a random graph, 4) consistent path length metrics, 5) causality results that yield the same results among empirical and randomly generated distributions. A modest proposal: relate Graph Models to Real World Graphs in terms of Causality
FutureWork Lack of availability of large causal graphs Difficult to generalize our findings over algorithms and applications Extend our research by collecting more thoughts on this matter. Compare causal Estimation Algorithms based on error metrics, akin to non-graphical statistical models. There is no consensus of such error metrics with respect to causal DAGs. A matter of course to develop antagonistic ground-truth models to recover large scale causal effects.