Download
1 / 30
300 likes | 326 Views
Explore the impacts of climate change in the polar regions and the importance of taking action. Learn about land ice-sheets, satellite measurements, sea-level rise, and the stability of the West Antarctic Ice-Sheet. Find out what is observed in the southern hemisphere and its unexpected effects. Discover the global sea-level rise and its impact on coastal cities.

E N D
Climate Change: Action at the Poles W. Richard Peltier Department of Physics University of Toronto
A Chance Correlation?? An early “hockey stick” Current, 2010, atmospheric CO2 concentration is 389 ppmv, which is to be compared to the pre-industrial level of ~280 ppmv, an increase of ~38% over the past ~160 years That global warming would be caused by increasing CO2 levels was predicted by the Nobel chemist Arhenious~1840
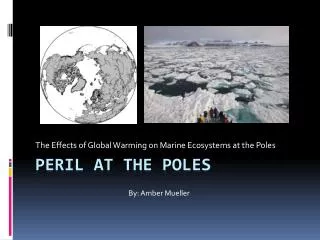
Outline • Motivation: Warming is amplified at high northern hemisphere latitudes where its impacts should be felt first. What about the southern hemisphere? • Land ice-sheets as polar “canaries” • The Gravity Recovery And Climate Experiment (GRACE) satellites • Meltback of the Greenland and Antarctic Ice-Sheets according to GRACE • The Topex-Poseidon and Jason-1 altimetric satellites; global sea level rise • Inter-hemispheric sea level “teleconnections” • The West Antarctic Ice-Sheet (WAIS): A 5 million year history of collapse and reformation • Which is the “most to be feared” polar ice-sheet? • Summary
Warming since the onset of NH industrialization Latest GISS analysis
Surface warming by decade: the phenomenon of polar amplification Surface warming is Most extreme in high Northern latitudes but Also on the Antarctic Peninsula
Temperature anomaly for July 2010 Russian wild fires Warming on the peninsula
Continental Ice-Sheets and Glaciers in the Modern Climate System: Polar “Canaries” Alaska Antarctica Greenland
The Gravity Recovery And Climate Experiment--GRACE GRACE employs a K-band microwave link to measure the distance between the COM’s of the two platforms (10 microns in distance accuracy) It delivers a new gravity field for each month of operation The time dependence of this global field is therefore measured directly This time dependence may be interpreted in terms of the loss or gain of surface mass associated with both past and ongoing changes in surface ice cover Interpretation of modern rates of change of surface ice cover require correction for ice-age influence Orbit Altitude 485 km Inclination 89 degrees Eccentricity ~0.001 non-repeat ground track earth pointed, three axis stable bus separation ~220 km
Comparison of GRACE with GIA: North America and Greenland Raw GRACE data Latest version of the Model Corrected for hydrology
Northern Hemisphere LGM Ice Cover CSM 1.4 Summer and Winter Sea ice ~21 ka Continental Ice Sheets
Sea level Impacts of Northern Hemisphere Land-Ice Melting
Estimating mass loss and global sea level rise: Alaska and Greenland Corrected for hydrology ~.15 mm/yr in Global sea level rise Corrected for GIA ~.62 mm/yr in Global sea level rise
What abut the southern hemisphere? What is observed is unexpected!
Estimating mass loss and global sea level rise: Antarctica CSR GFZ GIA GFZ-GIA CSR-GIA ~.32 mm/yr in global sea level rise ~.36 mm/yr in Global sea level rise
Stability of the WAIS over the past million years Lisieki and Raymo oceanographic forcing From Pollard and DeConto, Nature 2009
WAIS has oscillated in the past between a glaciated and a deglaciated state The Ross sea Sector
Rise of sea level due to collapse of the Greenland and/or West Antarctic Ice Sheet (WAIS) Total melt from Greenland is equivalent to 7.6 m of global sea level rise, from West Antarctica is 6.3 m of global sea level rise Predictions with the mean sea level subtracted to as to reveal spatial non-uniformity Note that the greatest rise of sea level occurs in the opposite hemisphere from that in which the melting occurs—a consequence of gravitational influence
Sea level rise impact at the locations of individual coastal cities, in Canada and elsewhere
The modern budget of global sea level rise
11 Topex/Poseidon Jason 1 Satellite Sea Level Altimetry
12 Global sea level rise since the onset of industrialization and the modern record from tide gauges, ocean hydrography and satellite altimetry (Topex/Poseidon-and Jason 1) Globally averaged sea level based upon both modern tide gauge recordings and other archives : Note the acceleration Note: The current rate of sea level rise based upon satellite altimetry is ~ 2.8 mm/year
Is GRACE observing the gain of ocean mass associated with land-ice melting?
Rate of mass addition to the oceans-unfiltered Global rate of SLR due to the addition of mass to the oceans based upon raw GRACE data = -0.28 mm/yr +/- 0.21 mm/yr Implying that the oceans are actually losing mass!!!
Models of Glaciation History---ICE-5G NOTE: these figures are from the recent paper by Peltier and Fairbanks that appeared in the December 2006 issue of QSR (25, 3322-3337). The new Barbados RSL curve has also appeared in the Working Group 1 Report of the IPCC AR4
Solutions of the sea Level Equation: Present-day rate of change of sea level Including rotational feedback Excluding rotational feedback (a) + dU/dt =dG/dt (a)-(b)
However- the GIA correction for the rate of mass addition to the oceans is VERY large and negative
A Question of (Mass) Balance, 2002-2008 Mass loss from the continents Greenland+Alaska+Antarctica = ~1.05 mm/yr (Peltier, 2009, QSR) Small ice sheets and glaciers = ~0.95 mm/yr (Meier et al, 2007, Science) Continental drying = ~0.17 mm/yr (GLDAS) TOTAL = 2.17 mm/yr +/- 0.37 mm/yr Mass gain by the oceans Raw GRACE signal =~-0.28 mm/yr Correction due to spectral leakage =~-0.43 mm/yr Correction due to GIA (ICE-5G(VM2)) =~-1.80 mm/yr TOTAL = 1.95 mm/yr +/- 0.16 mm/yr It will be clear that mass balance is achieved only because of the magnitude of the GIA correction for the rate of gain of mass by the oceans
Ice Melting • Rising Seas • Massive Greenland and West Antarctic ice sheets are melting at accelerating rates • Together hold enough water to raise sea level 12 meters (39 feet) • A 10 meter rise in sea level today would inundate coastal areas home to more than 600 million people The risk is that climate change could spiral out of control, making it impossible to arrest trends such as rising temperatures, ice melting, and rising seas, threatening food security and creating hundreds of millions of climate refugees. Photo Credit: Yann Arthus-Bertrand
Summary • The impacts of global warming are exacerbated at the poles: in the northern hemisphere due to the direct of air temperature; in the southern hemisphere due to ocean warming • Land ice melting in both hemispheres is making a significant contribution to global sea level rise • The GRACE satellites are able to directly constrain the rate of loss of land ice in the major ice catchments but NOT for the smaller ice sheets and glaciers • Because of the “opposite hemisphere effect”, northern hemisphere communities would be most strongly impacted by a collapse of the WAIS