Download
1 / 15
150 likes | 736 Views
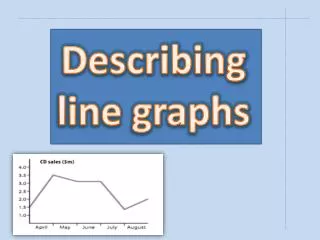
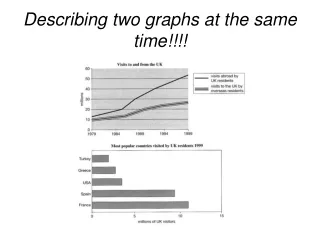
Describing Trends in Graphs. 1. Production started climbing steadily but flattened off at a level of around 70. Since then, it has fallen steadily. 2. Production grew more and more rapidly over the first three quarters but then reached a peak. Since then, it has quickly dropped. 3.

E N D
1 Production started climbing steadily but flattened off at a level of around 70. Since then, it has fallen steadily.
2 Production grew more and more rapidly over the first three quarters but then reached a peak. Since then, it has quickly dropped.
3 Production grew rapidly in the first quarter, but reached a plateau of about 70. Since then it has remained more or less stable.
4 Production has dropped slowly but steadily over the year.
5 Production started the year in a stable position, but then plunged in the third quarter. It has now flattened out at a level of 20.
6 Production fell considerably over the first three quarters, reaching a low of 20. Since then it has staged a partial recovery.
7 Production has fluctuated all year.
8 Production started off steady, but fell sharply in the last quarter.
9 Production showed a marginal rise in the first three quarters, but then suffered a sharp drop.
10 After a considerable drop in the first two quarters, production bottomed out at 20. Since then it has started to rise.
11 Production has experienced a strong, steady growth over the whole year.
12 There has been a slight increase in production over the year.
13 There was a rapid drop in production in the first quarter, but it bottomed out at about 20.