Download
1 / 16
160 likes | 273 Views
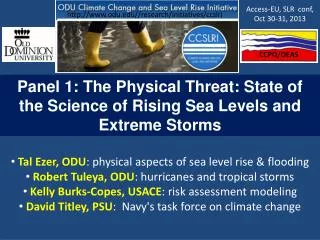
Access-EU, SLR conf, Oct 30-31, 2013. http://www.odu.edu//research/initiatives/ccslri. CCPO/OEAS. Panel 1: The Physical Threat: State of the Science of Rising Sea Levels and Extreme Storms. Tal Ezer , ODU : physical aspects of sea level rise & flooding

E N D
Access-EU, SLR conf, Oct 30-31, 2013 http://www.odu.edu//research/initiatives/ccslri CCPO/OEAS • Panel 1: The Physical Threat: State of the Science of Rising Sea Levels and Extreme Storms • Tal Ezer, ODU: physical aspects of sea level rise & flooding • Robert Tuleya, ODU: hurricanes and tropical storms • Kelly Burks-Copes, USACE: risk assessment modeling • David Titley, PSU: Navy's task force on climate change
, November, 2010 , June, 2012 “Norfolk- second only to New Orleans among U.S. cities threatened by flooding” Norfolk in the News PBS, April, 2012 Virginian Pilot, February, 2012
4-foot flood (high-tide, no storm, 8/25/2012) Historic Hague district of Norfolk Minor Tidal Flooding: Used to be a rare event, now almost every month… flood wall
5-foot flood (high-tide & small storm, 10/09/2013) flood wall Medium Flooding: Until 1960s- once in 2y event Now- several times a year
7-foot flood (hurricane Sandy, 10/29/2012) Major Flooding: Past- once in 30y event Now- once in 2y event after before
Questions: • What causes Sea Level Rise (SLR)? • How do SLR and storms affects flooding? • Why sea level is rising faster at some places (e.g., along the U.S. East Coast) than others? • How can we make SLR projections? and use the information to plan future adaptation or mitigation
Sea level rise rates at points along the US East Coast are relatively higher than in other places “hotspot of accelerated sea level rise” (Sallenger et al., 2012; Boon, 2012; Ezer et al., 2013; Kopp, 2013) SLR in the mid-Atlantic ~3-6 mm/y compared with global SLR of past century of ~1.7 mm/y
Global vs. Local Sea Level Rise: Local (relative) SLR = Global SLR ± Land Subsidence/Uplift ± Ocean Dynamics thermal expansion melting ice sheets & glaciers volume change Low water High water Gulf Stream • Land is sinking around the Chesapeake Bay: • Postglacial Rebound • Chesapeake Impact Crater • Groundwater removal Climate change in ocean currents may slowdown the Gulf Stream and increase sea level along the mid-Atlantic coast (Ezer et al., 2013)
Sea Level Rise over the past 130 years Storm surge Storm+Tide Local tide gauge (Norfolk) Local SLR Satellite data Tide gauge data (global) Global SLR
Top storm surges in Norfolk, VA 2009 1933
- What causes this dramatic increase in flooding? Sea level rise ~36cm (1.2ft)
Mean Sea Level Rise Rates (from linear regression) linear local land subsidence + linear global SLR Cape Hatteras North of Cape Hatteras Global South of Cape Hatteras Atlantic mm/y
Sea Level Rise Acceleration • (SLR will be faster in the future than it was in the past) • Eliminates the long-term geological land movement which is constant Cape Hatteras North of Cape Hatteras South of Cape Hatteras mm/y2 Atlantic Global
Gulf Stream measurements: • from satellite altimeter • from cable across the Florida Straits Is the Gulf Stream weakening after 2004? Florida Current Transport Gulf Stream Gradient
Sea level rise is not constant: Why do stations in different locations show the same pattern? Acceleration in sea level Sea Level Gulf Stream SL (m) Chesapeake Bay Decline in Gulf Stream strength since 2004 Atlantic Coast
Global sea level scenarios (based on climate models) • Main Points: • sea level is not rising evenly • sea level is not rising in a constant rate (decadal variations & acceleration) • global projections have large range (different scenarios) • need accurate local/regional SLR projections for planning purposes Local projections (Boston, MA) (based on statistical models)