Download
1 / 44
550 likes | 1.75k Views
Physical Science Earth and Space Science Life Science In this class we will be focusing on Physical Science, which mainly focuses on the study of non-living things. What is Physical Science? 1-1. Natural Science is divided into 3 main branches:. Introduction to Physical Science.

E N D
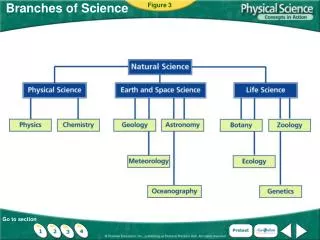
Physical Science • Earth and Space Science • Life Science In this class we will be focusing on Physical Science, which mainly focuses on the study of non-living things. What is Physical Science? 1-1 Natural Science is divided into 3 main branches:
Introduction to Physical Science (More Information on this topic can be found in Chapter One in your textbook.)
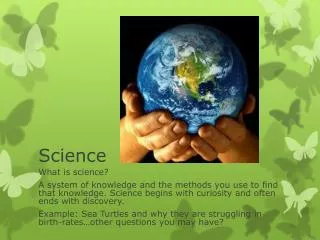
Physical Science is the study of matter, energy, and the changes they undergo. • Matter is anything that has mass and occupies space. • Energy is the ability to do work or cause change. So what is Physical Science?
PHYSICS CHEMISTRY • Study of matter, energy, motion, forces, and how they interact • Learn about different forms of energy • Apply the laws of physics that govern energy to Earth, the solar system, and the universe beyond • Ever wonder how a laser works? A physicist knows! • Study of the properties of matter and how matter changes • Learn about the particles that make up matter and properties of different forms of matter • Hydrogen alone is combustible. Oxygen alone is combustible. When combined in the form of water, H2O, they put out fire! Why? Branches of Physical Science
Because it is used everyday in the real world! Consider these examples: • The water you shower with is heated by chemical fuel or electricity • You use force to crush food when you eat • The food you eat is converted into chemical energy that your body uses to perform all of your daily tasks • There are chemicals in toothpaste you use to brush your teeth Why Study Physical Science?
Observing- Using one or more senses to gather information. 2 Types of observations: 1) Qualitative Observations- Do not involve numbers or measurements, “That man is tall.” 2) Quantitative Observations- Involve measurements, “That man is 6’5” tall.” • Inferring (or making an inference)- Based on your observations or what you already know; not always correct. • Predicting- making forecast of what will happen in the future based on past experience or evidence Skills Scientists Use:
INFERENCE OBSERVATION OBSERVATION How did you do? INFERENCE
Scientific Inquiry refers to the different ways scientist study the natural world. It is the ongoing process of discovery in Science. • In the process of scientific discovery, scientists use curiosity, honesty, open-mindedness, skepticism, and creativity. Scientific Inquiry 1-2 • How do scientists investigate the natural world? • What role do models, theories, and laws play in science? What is Scientific Inquiry?
Posing questions • Developing hypotheses • Designing experiments • Collecting and interpreting data • Drawing conclusions • Communicating ideas and results • This process is NOT always linear!!! Process of Inquiry Includes:
There is no set path that a scientific inquiry must follow. Different scientists may choose different paths when studying the same event. The Scientific Method • The scientific method is a more linear, organized way to inquire about science. • It always starts with an observation. The Nature of Inquiry
*Variable that is deliberately changed= manipulated variable (independent variable) What is the independent variable in this experiment? (Hint: What are we changing?) *Variable that is observed and changes in response= responding variable (dependent variable) -What is the dependent variable in this experiment? (Hint: What is changing because of our independent variable?) THE LIGHT BULB! Controlled Experiments…Only 1 thing (called a variable) changes WHETHER OR NOT THE LIGHT TURNS ON!
*All other variables in the experiment are held constant, which means they never change= controlled variable (constant variable) -What are some of the controlled variables in this experiment? THE LAMP, THE ROOM, THE ELECTICAL OUTLET Controlled Experiments Continued
Recording & Analyzing Data Organize your data into charts and graphsso that it is easier to recognize patterns Example:
Draw Conclusions Decide if the evidence supports or rejects your hypothesis. Example: All light bulbs in that lamp plugged into the same outlet are not functioning, therefore I will reject my initial hypothesis because it is unlikely that all light bulbs are burnt out. Rejecting your original hypothesis is valid information because it helps you rule out possible causes to the problem or question and allows you to make a new hypothesis and start the steps of the scientific method over again.
Since our Hypothesis was not correct, we will go back to step #4 and form another hypothesis that we can test…. ANY IDEAS??? • After we form our new hypothesis, we will go back through the steps of the scientific method! • Once we find a hypothesis that is correct, we have answered our question! • In larger experiments, scientists will write up lab reports, repeat their experiments, publish their results, or even branch out from the experiment to test other ideas.
Communicating Results Why would scientists want to write lab reports and/or publish their results? So other scientists can learn from their data, and to possibly receive credit for their work. Why would scientists want to repeat their experiments? To make sure their results are accurate.
When a hypothesis is tested and confirmed enough times that it is unlikely to be proven wrong by future tests • In science, the word theoryapplies to a well-tested explanation that brings together a lot of observations • A theory may be changed or replaced as new evidence is discovered When does a hypothesis become a theory?
Why do scientists use a standard measurement system? • What are the SI units of measurement for length, mass, volume, density, time, and temperature? Measurement 1-3
Using SI as the standard system of measurement allows scientists to compare data and communicate with each other about their results. • SI units are based on multiples of 10. We will be using SI and other metric units. A Standard Measurement System
The basic unit of length in SI is the meter (m). • To measure something larger than a meter, scientists may use kilometers (km), which means one thousand. • To measure something smaller than a meter, scientists may use centimeters (cm) or millimeters (mm). centi- ,in centimeters (cm), means one-hundredth milli -,in millimeters (mm), means one-thousandth. Length
Consider a ruler • This ruler shows both Metric and English units for measuring length • The numbers on the top are centimeters • The tiny lines within each centimeter are millimeters. • Notice there are 10 mm in 1 cm. COUNT THEM! • How many mm are in 3 cm? • The numbers on the bottom are inches • Notice how much bigger 1 in is compared to 1 cm • There are 2.54 cm in 1 in • We will practice converting from Metric to Metric later!
Weight: Mass: • Your weight is a measure of the force of gravity on you. • The force of gravity may be more or less on other planets or moons than on Earth. • You would weigh about one-sixth of your Earth weight on the moon. • The newton (N) is the SI unit, the pound (lb) is the English unit. • Mass is the measure of the amount of matter an object contains. • Mass is not affected by gravity. • If you travel to the moon, the amount of matter in your body (your mass) will not change. • Scientists prefer to use mass rather than weight. • SI unit of mass is the kilogram (kg), but we will be using mostly grams (g) in this class. WEIGHT vs MASS
Volume is the amount of space an object takes up. • The SI unit of volume is the cubic meter (m3), but we will most often measure in milliliters (mL) and cubic centimeters (cm3). Volume
Graduated cylinder (mL) • Meniscus- curved surface at top of liquid, always record measurements at eye level using bottom of the meniscus Volume of a liquid:
Example- Cereal box • Volume = Length x Width x Height • Remember to multiply numbers and units, so units will be cubed (Ex. cm3) • Example- Rock • Submerge object in water in graduated cylinder and measure the displacement of the water (Ex. mL) Regular Solids Irregular Solids Volume of Rectangular and Irregular Solids:
Two objects of the same size can have very different masses because different materials have different densities! • Density is mass per unit volume So Density = Mass/ Volume • SI unit of density is kg/m3, other common units are g/cm3 and g/mL • Since density is made up of 2 measurements, it always has 2 units Density
The density of a substance stays the same no matter how large or small a sample of the substance is. • So a gold earring and a gold necklace will both have a density of 19.3 g/cm3 Density
Knowing an object’s density allows you to predict whether it will sink or float. • If the object is less dense than the liquid, it will float. • If the object is more dense than the liquid, it will sink. Problem: Water has a density of 1 g/cm3. Will an object with a density of 0.7 g/cm3 float or sink in water? FLOAT! Sink or Float?
Scientists use the Celsius and Kelvin scales to measure temperature. • The kelvin (K) is the SI unit of temperature. Temperature
What math skills do scientists use in collecting data and making measurements? More Math in Science 1-4
An approximation of a number based on known/ reasonable information • Scientists cannot always obtain EXACT numbers • Example: measuring distances between stars Estimation:
Accuracy: Reproducibility: • How close a measurement is to the true value • Example: If you were playing darts, accurate throws land close to the bull’s-eye • How close a group of measurements are to each other • Example: Reproducible throws land close to one another Scientists aim for both accuracy and reproducibility in their measurements. Accuracy and Reproducibility
What type of data can line graphs display? • Why are line graphs powerful tools in science? Graphs in Science 1-5
Why use Graphs? • Because of their visual nature, graphs can reveal patterns or trends that words and data tables cannot. • Scientists commonly use bar graphs, circle graphs, and line graphs.
Line graphs are used to display data to show how one variable changes in response to another variable. • In this experiment, the responding variable is the time it takes for the water to boil. The manipulated variable is the volume of water in the pot. The Importance of Graphs
A line of best fit emphasizes the overall trend shown by all the data taken as a whole. Why Draw a Line of Best Fit?
Line graphs are powerful tools in science because they allow you to identify trends and make predictions. • This graph’s data forms a straight line, so it is linear Using Graphs to Identify Trends
Not all line graphs will have data that fall on a straight line. • This graph is nonlinear Using Graphs to Identify Trends
Even nonlinear graphs with no recognizable pattern provides useful information to scientists… • It most likely means that there is no relationship between the two variables. No trend
1. Draw the axes 2. Label the axes horizontal axis = x-axis = independent variable(manipulated variable) vertical axis = y-axis = dependent variable (dependent variable) 3. Create a scale The parameters of the scale is BASED ON the data 4. Plot the data 5. Draw a line of best fit (focus on general pattern, not connecting dots 6. Add a title include both independent and dependent variables * Page 37 in your textbook is a good reference for you. Process for Constructing Graphs