Download
1 / 62
650 likes | 886 Views
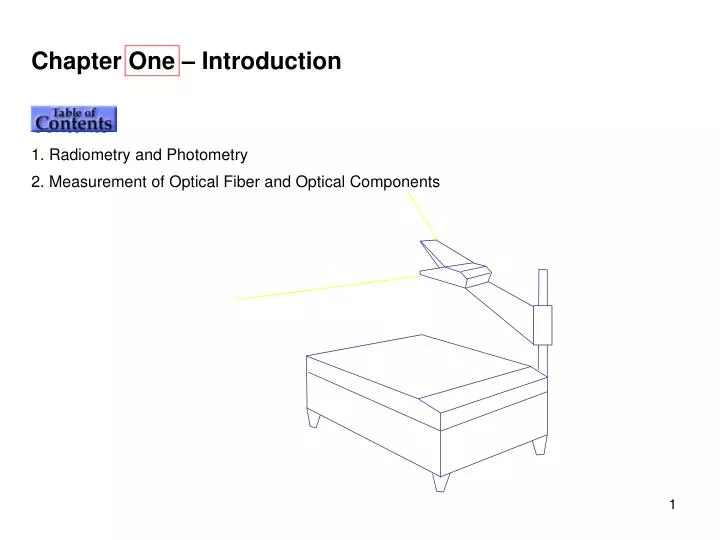
Chapter One – Introduction Contents 1. Radiometry and Photometry 2. Measurement of Optical Fiber and Optical Components. Question Derive the projected area for the shapes of flat rectangular, circular disc and sphere?. Question Find the conversion between degrees and radians?. Questions

E N D
Chapter One – Introduction Contents 1. Radiometry and Photometry 2. Measurement of Optical Fiber and Optical Components
Question • Derive the projected area for the shapes of flat rectangular, circular disc and sphere?
Question • Find the conversion between degrees and radians? • Questions • How many steradians in one hemisphere? • What are the dimensions for plane angles and solid angles?
Question • How to express energy in terms of power?
Question • How to express power in terms of irradiance (or radiant exitance) ?
Questions • How to express power in terms of radiant intensity? • How to express power in terms of radiance?
Question • How much lumens are emitted by an isotropic source having a luminous intensity of 1 candela?
Question • Calculate the lumens for a 5 mW laser at 635 nm. V(λ) is 0.217 at this wavelength.
Optical Measurements • Introduction • Early fiber optic systems need only modest test. • Now the industry is evolving, thus optical fibre systems and measurement technology need to be improved. • Narrow wavelength spacing: • WDM systems with 100 GHz • E.g. power, signal-to-noise ratio, wavelength • High data rates: • > 10 Gb/s requires compatible components characteristic • E.g. spectrum width, dispersion, bandwidth response • Optical amplifier: • Enabling WDM systems • E.g. gain, noise figure • Question • Why need accurate and reliable optical test & measurement techniques?
Optical Measurements • Introduction • Expansion of optical communication systems • Replacing copper cables everywhere, towards access area • Complex fibre optic systems • All optical networks – passive and active • Self-review of the basic features of a fiber-optic communication link are necessary. • Fibre optic link measurements determine if the system meets its end design goals. • All of the components contained within the link must be characterized and specified to guarantee system performance. • Question • What are the things to know before proceeding with fiber optic test & measurement?
Optical Measurements • Introduction • Optical fibres: • Singlemode fibres – Standard fibre, Dispersion-shifted fibre, Non-zero Dispersion-shifted fibre, Polarization Maintaining fibre, Erbium-doped fibre • Multimode fibres – Step index, Graded-Index • Optical components: • Two-port optical components: have optical input and optical output. E.g. WDM coupler, Bandpass filter, Isolator • Single-port components. E.g. Transmitter, Receiver • This chapter will briefly introduce the types of measurements that can be made to the fibre optic and optical components. • The details of each measurement will be discussed in the dedicated chapters. • Question • What are the parameters to measure?
Measurement of Optical Fibre and Two-port Components Insertion Loss Both a source and receiver are necessary Source – a wavelength tunable laser or a broadband source Receiver – an optical power meter (OPM) or an optical spectrum analyzer (OSA) The figure below shows a typical measurement set-up for an insertion loss measurement. • Question • What are the principal differences between the two sources?
Measurement of Optical Fibre and Two-port Components • Insertion Loss • Optical power meter • Calibrated optical to electrical converter • No wavelength information • Optical spectrum analyzer • Tunable bandpass filter + power meter • Questions • Does an optical spectrum analyzer provide wavelength information and why? • How to use an OPM but still getting the wavelength information?
Measurement of Optical Fibre and Two-port Components • Insertion Loss • TLS + OPM • Large measurement range, but < 200nm • Fine wavelength resolution • Major limitation – broadband noise from TLS • Questions • What is the noise referring to? • How to improve the measurement using the TLS?
Measurement of Optical Fibre and Two-port Components • Insertion Loss • TLS + OSA • Highest performance solution • TLS provides narrow spectral width • OSA provides additional filtering of the broadband noise emission • Questions • What is the direct effect on the measured spectrum by using the above configuration?
Measurement of Optical Fibre and Two-port Components • Insertion Loss • Broadband emission source + OSA • Wide wavelength range coverage • Moderate measurement range • Fast measurement speed • Tungsten lamp emitters – entire fibre-optic communication wavelength range • Optical amplifiers – narrower wavelength ranges, but with much higher power • Question • What is the disadvantage of a tungsten lamp source?
Measurement of Optical Fibre and Two-port Components • Amplifier Gain and Noise Figure • Gain measurements • Often done in large signal conditions – gain saturation • Requires a high-power excitation source • Characterization of noise • Optical domain – measure the level of ASE coming from the amplifier • Electrical domain – use a photodetector and an electrical spectrum analyser to characterize the total amount of detected noise produced by the system • Question • What is the potential error in the measurement of the amplifier noise?
Measurement of Optical Fibre and Two-port Components Amplifier Gain and Noise Figure The figure below shows a test configuration used to measure gain and noise figure of optical amplifier For WDM systems – characterization needs the same signal-loading conditions as in the actual application • Question • Why is there a difference in the optical amplifier characterization between single- and multi-channel systems?
Measurement of Optical Fibre and Two-port Components • Chromatic Dispersion • Measurement is accomplished by analyzing the group delay through the fiber/components as function of wavelength • Procedure • A wavelength tunable optical source is intensity modulated • The phase of the detected modulation signal is compared to that of the transmitted modulation • The wavelength of the tunable source is then incremented and the phase comparison is made again • The phase delay is converted into the group delay • Question • What is the waveform shape of the modulation signal?
Measurement of Optical Fibre and Two-port Components Chromatic Dispersion The figure shows the result for the measurement of the group delay with wavelength • Question • How can the group delay be calculated from the phase delay?
Measurement of Optical Fibre and Two-port Components Chromatic Dispersion The figure shows the chromatic dispersion measurement set-up for two-port optical devices Accurate characterization of the minimum fibre dispersion wavelength is important in the design of high-speed TDM and WDM communication systems Dispersion compensation components also require accurate measurement of dispersion • Question • Why is it important to characterize chromatic dispersion of fibre?
Measurement of Optical Fibre and Two-port Components • Polarization • Polarization of the lightwave signal refers to the orientation of the electric field in space • E.g. insertion loss and group delay of a two-port optical component vary as a function of the input polarization • Polarization transfer function characterization • Polarization analyzer measures the polarization state • The polarization state is represented by a Jones polarization-state vector • Jones state vector contains two complex numbers that quantify the amplitude and phase of the vertical and horizontal components of the optical field • Question • How does the polarization state of a linearly polarized light evolve in a fibre?
Measurement of Optical Fibre and Two-port Components • Polarization • The Jones matrix measurement • Apply three well-known polarization states at the input • Characterize the resulting output polarization state in the polarization analyzer • The Jones matrix of the polarization transfer function will predict the output polarization state for any input polarization state • The figure below illustrates a measurement technique to characterize the polarization transfer function of optical fibre and components.
Measurement of Optical Fibre and Two-port Components Reflection Optical time-domain reflectometry (OTDR) can measure reflection from the surfaces of components or fibres (thus fibre breaks) The figure shows an OTDR measurement block diagram OTDR injects a pulsed signal onto the fibre optic cable A small amount of the pulsed signal is continuously reflected back in the opposite direction by the irregularities in the optical fibre structure – Raleigh backscatter • Question • Why is a pulsed signal necessary?
Measurement of Optical Fibre and Two-port Components • Reflection • The figure shows an example OTDR display • The locations and magnitudes of faults • Determined by measuring the arrival time of the returning light • Reduction in Raleigh scattering and occurrence of Fresnel reflection • Question • How to determine the locations and magnitudes of faults?
Measurement of Transmitter and Receiver • Power • The figure illustrates a basic power-meter instrument diagram • Process • Source – optical fibre – photodetector – electrical current • Responsivity • The conversion efficiency between the input power and the output current • Units of Amps/Watt • A function of wavelength for all photodetectors • Must be calibrated in order to make optical power measurements
Measurement of Transmitter and Receiver • Power • Thermal-detector heads • Measure the temperature rise caused by optical signal absorption • Very accurate and are wavelength-independent • Suffer from poor sensitivity • Thermal detectors are used to calibrate photodetectors • Upper power limit • Determined by saturation effects • Responsivity decreases beyond this point • Lower power limit • Limited by the averaging time of the measurement and the dark current • Design considerations • Power meters have to be independent of the input polarization • The reflectivity of the optical head has to be eliminated
Measurement of Transmitter and Receiver • Polarization • Light sources • Laser sources are predominantly linear polarized sources • LEDs have no preferred direction of polarization and are predominantly unpolarized • Polarization effects • Polarization-dependent loss, gain, or velocity • These are influenced by the ambient conditions, e.g. stress, temperature • Thus, a polarized input will perform unpredictably • Polarization measurement • To determine the fraction of the total light power that is polarized • To determine the orientation of the polarized component • Question • Gives the names for the polarization effects?
Measurement of Transmitter and Receiver • Polarization • The figure illustrates a polarization analyzer instrument • Polarization analyzer • Four power meters with polarization characterizing optical components • It measures the Stokes parameters: S0, S1, S2, S3 • S0 – total power of the signal • S1 – power difference between vertical and horizontal polarization components • S2 – power difference between +45 and -45 degrees linear polarization • S3 – power difference between right-hand and left-hand circular polarization • S1 and S2 are measured with polarizers in front of detectors • S3 is measured with a waveplate in front of a detector
Measurement of Transmitter and Receiver • Polarization • The polarization state of a source is conveniently visualized using a Poincaré sphere • Poincaré sphere • The axes are the Stokes parameters normalized to S0 – values are between 0 and 1 • Polarization state is represented by the three-dimensional coordinates (S1, S2, S3) • Questions • What is the state the outer surface of the sphere represents? • What is the polarization state along the equator? • What is the polarization state between the equator and the poles?
Measurement of Transmitter and Receiver • Polarization • The degree of polarization (DOP) is used to indicate the extent of polarization in a source. • DOP • 100% is found on the outer surface • 0% is found in the centre • The polarization of an optical signal is constantly changing, thus all optical components should be polarization independent • Questions • Why does the polarization of an optical signal constantly changing? • What is the benefit of having polarization-independent components?
Measurement of Transmitter and Receiver Optical Spectrum Analysis An optical spectrum analyzer (OSA) is used to measure the power versus wavelength The figure shows an OSA that uses a diffraction grating • Question • What is a diffraction grating?
Measurement of Transmitter and Receiver • Optical Spectrum Analysis • OSA • Consists of a tunable bandpass filter and an optical power meter • The light from the input fibre is collimated and applied to the diffraction grating • The diffraction grating separates the input light into different angles depending on wavelength • The light from the grating is then focused onto an output slit • The grating is rotated to select the wavelength that reaches the optical detector • Question • What are the components in the OSA that constitute to the tunable bandpass filter?
Measurement of Transmitter and Receiver • Optical Spectrum Analysis • The filter bandwidth is determined by • the diameter of the optical beam that is incident on the diffraction grating • the aperture size at the input and output of the optical system • Fabry-Perot (FP) filters • Can also be used as the bandpass filter • Offer the possibility of very narrow wavelength resolution • The disadvantage is that these filters have multiple passbands • Question • What are the consequence of having a bandpass filter with multiple passbands in an OSA?
Measurement of Transmitter and Receiver • Optical Spectrum Analysis • The figure below shows a spectral plot for a DFB laser that is modulated with 2.5 Gb/s digital data • Accurate spectral measurement • The OSA must have a very narrow passband and steep skirts • A filter stopband should be ≥ 50 dB down to measure the smaller sidelobes. • OSAs do not have sufficient resolution to look at the detailed structure of a laser longitudinal mode • Question • What determines the value of the stopband?
Measurement of Transmitter and Receiver • Accurate Wavelength Measurement • The figure below illustrates a method by which very accurate wavelength measurements can be made • Michelson interferometer configuration • The light from the unknown source is split into two paths • Both are then recombined at a photodetector • One of the path lengths is variable and the other is fixed in length
Measurement of Transmitter and Receiver Accurate Wavelength Measurement As the variable arm is moved, the photodetector current varies To accurately measure the wavelength of the unknown signal, a reference laser with a known wavelength is introduced into the interferometer • Question • Why does the photodetector current vary?
Measurement of Transmitter and Receiver • Accurate Wavelength Measurement • The wavelength meter compares the interference pattern from both lasers to determine the wavelength • This procedure makes the measurement method less sensitive to environmental changes • Reference lasers • Helium-neon (HeNe) lasers emitting at 632.9907 nm are often used as wavelength references • HeNe lasers have a well-known wavelength that is relatively insensitive to temperature • Wavelength meters have limited dynamic range compared to grating-based OSAs • Question • Why does the use of reference laser make the wavelength meter less sensitive to environmental changes?
Measurement of Transmitter and Receiver • Linewidth and Chirp Measurement • Heterodyne and homodyne analysis tools are used to examine the fine structure of optical signals • These analysis methods allow the measurement of modulated and unmodulated spectral shapes of the longitudinal modes in laser transmitter • Heterodyne • The figure illustrates a heterodyne measurement setup • The unknown signal is combined with a stable, narrow-linewidth local oscillator (LO) laser • The LO signal is adjusted to be within 50 GHz of the unknown signal to be detected by conventional electronic instrumentation
Measurement of Transmitter and Receiver • Linewidth and Chirp Measurement • Heterodyne • The LO must have the same polarization for best conversion efficiency • The two signals mix in the photodetector to produce a difference frequency (IF signal) in the 0 to 50 GHz region • The IF signal is analyzed with an electronic signal analyzer (e.g. a spectrum analyzer) • The figure shows the measurement of a laser under sinusoidal modulation at 500 MHz • The major limitation is the availability of very stable LO signals
Measurement of Transmitter and Receiver • Linewidth and Chirp Measurement • Homodyne • Limited information on the optical spectrum • Much easier to perform • LO is a time-delayed version of itself (more than the inverse of the source spectral width (in Hz)) – phase independent • The intermediate frequency is centred around 0 Hz • Limitations • Asymmetries of the optical spectrum can not be seen • No information about the centre wavelength of a laser • Question • Why is the intermediate frequency for the homodyne technique centred around 0 Hz?