Download
1 / 25
250 likes | 431 Views
U.S. Navy Global Ocean Prediction Update. Key Performers: A.J. Wallcraft, H.E. Hurlburt, E.J. Metzger, J.G. Richman, J.F. Shriver, P.G. Thoppil, O.M. Smedstad, L. Zamudio. 2011 GODAE OceanView Technical Workshop on

E N D
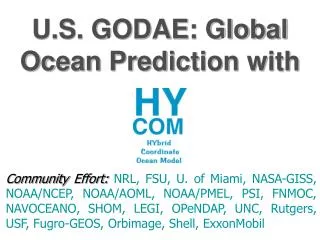
U.S. Navy Global Ocean Prediction Update Key Performers: A.J. Wallcraft, H.E. Hurlburt, E.J. Metzger, J.G. Richman, J.F. Shriver, P.G. Thoppil, O.M. Smedstad, L. Zamudio 2011 GODAE OceanView Technical Workshop on Observing System Evaluation and Inter-comparison 13-17 June 2011 Santa Cruz, CA
Modeling tides in the global model • In the global model, the body forces due to the tidal potential, self attraction and loading have been added • Tidal Forcing with 8 constituents: • Semidiurnal M2, S2, N2 and K2 • Diurnal O1, P1, Q1 and K1 • Topographic wave drag is applied to the tidal motions • The form of the drag is generalized from the linear topographic wave drag, but tuned to minimize the difference with the 102 pelagic tide gauges using a barotropic version of the model
Comparison of M2 tide from Data-Assimlative Shallow Water Model (TPXO7.2) and HYCOM Simulation TPXO7.2 M2 Tidal Model HYCOM M2 Tide Difference with 102 pelagic tide gauges 7.8 cm rms Difference with TPXO7.2 model 5.4 cm rms
M2 internal tide amplitude: along-track altimetry data vs 1/12 Global HYCOM Analysis of along-track altimetry data based upon extracting the aliased tidal signal from the repeat-cycle data as described by Ray and Mitchum (1996, 1997) The internal tide is recovered by a spatial filter to separate the barotropic and baroclinic tides Atlimeter analysis provided by Richard Ray HYCOM SSH analyzed for tides, sampled along track and filtered similar to altimeter Altimetry-based analysis cm HYCOM
M2 internal tide amplitude: along-track altimetry data vs 1/12 Global HYCOM Altimetry-based analysis HYCOM cm
Large Scale Prediction GOFS V3.5 Mean SSH 2004-2009 1/25° non-assim. global HYCOM 1/12° non-assim. global HYCOM Forced with 0.5° NOGAPS winds and heat fluxes
Large Scale Prediction GOFS V3.5 SSH Variability (cm) 2004-2009 Satellite observations from CLS 1/25° non-assim. global HYCOM 1/12° non-assim. global HYCOM
1/12° NCODA(3DVAR) / ISOP / CICE Hindcast Matrix Plans for 1/12° Global Forecast System (GOFS 3.1) Hindcasts 1-3 will cover approximately a three month period and incrementally build upon each other. It is anticipated that hindcast four will be the final configuration of GOFS V3.1 and so this will be integrated an entire year.
HYCOM Data Serving http://www.hycom.org/dataserving • Near real-time 1/12° global HYCOM/NCODA prediction system output (Nov 2003-present) • 1/12° global non-assimilative HYCOM output (2003-2006) • 1/12° North Atlantic data assimilative HYCOM output (2003-2008) • 1/12° Pacific non-assimilative HYCOM output (1979-2003 – monthly means) Variables remapped to 33 standard levels: 3D – T, S, U, V, ρ; 2D – SSH, SST, SSS, MLD, …
Questions? 1/12º Global HYCOM
ISOP corrects climatological or model backgrounds based on climatologically observed modes of variability Remote sensing (SST, SSH) + uncertainty • EOFs of T, S • Model mixed layer, deep layer, transitions • minimize variance among background, observations Background from climatology or model forecast + uncertainty Synthetic profile of T,S or corrections to background ISOP in situ observations + uncertainty Mixed-layer depth estimate + uncertainty
Eddy Kinetic Energy at the Surface Eddy Kinetic Energy (cm2/s2)
Eddy Kinetic Energy at the Surface in the Gulf Stream The 1/25 model has the highest EKE with a larger southern recirculation gyre Data assimilation brings the EKE close to the observations from the drifters
Summary of Surface EKE Increasing the resolution or assimilating data increases the EKE to levels comparable to the drifter observations Increasing the resolution increases the KEM while assimilating data decreases the KEM Part of the doubled resolution EKE increase may be associated with surface quasigeostrophic motions Interannual variability about 15 cm2/s2 in EKE and 20 cm2/s2 in KEM
Why does the 1/25° Model Perform so much better? • Much emphasis for the global models has been focused on resolving the eddy scales (Rossby radius of deformation) • The dynamics are governed by the energy and enstrophy cascades and interactions. • In the surface enstropy cascades to small scales and energy towards the Rossby radius, where it is transferred in the vertical (barotropization) • The barotropic eddy kinetic energy can be transferred to the mean (a mechanism for the downstream increase in the Gulf Stream) • The enstropy cascades are a critical part of this cycle, which are resolved better in the higher resolution model • Increasing the eddy kinetic energy in the surface by data assimilation improves the model but does adequately resolve the enstropy cascades
Surface Eddy Kinetic Energy Differences in Surface Eddy Kinetic Energy (cm2/s2) 1/25° – 1/12° 1/12° 1/12° Tides – 1/12° 1/12° DA – 1/12°
What happens in the simulations? • We find that the resolution of the present generation of ocean general circulation models of ~1/10° is inadequate to establish a vigorous abyssal circulation and the surface eddy kinetic energy (EKE) is only about 85% of the observed. • Adding tidal forcing has a minimal impact on the surface circulation but increases the deep EKE by 12% and the deep KEM by 25%. • Doubling the horizontal resolution of the model increases the surface EKE to levels comparable to the drifter observations and increases the KEM by 40%, which is greater than the drifter estimates. The deep EKE and KEM also are increased to levels consistent with the deep current meters. • Data assimilation increases the surface EKE to levels consistent with the drifter observations and increases the deep EKE and KEM. Surprisingly, data assimilation weakens the KEM at the surface and upper thermocline to levels below the 1/12° simulation.
Kinetic Energy of the Mean Flow at the Surface Mean Kinetic Energy at Surface (cm2/s2) 1/12° Drifters
Large Scale Prediction GOFS V3.5 Maximenko and Niiler Mean SSH 2004-2009 1/25° non-assim. global HYCOM
Large Scale Prediction GOFS V3.5 Mean SSH 2004-2009 1/25° non-assim. global HYCOM 1/12° non-assim. global HYCOM Forced with 0.5° NOGAPS winds and heat fluxes
Large Scale Prediction GOFS V3.5 SSH Variability (cm) 2004-2009 Satellite observations from CLS 1/25° non-assim. global HYCOM 1/12° non-assim. global HYCOM