Download
1 / 21
210 likes | 212 Views
This report examines the estimation of air pollutants and greenhouse gas (GHG) releases in the Chungnam Province. It discusses compliance and reduction strategies, with a focus on power plants. Lessons learned for policy development are also highlighted.

E N D
Emission Status of Air Pollutants for the Compliance of Climate Change Jong-Gwan JUNG Gab-Sue JANG Chungnam Development Institute(CDI)
- CONTENTS - I. Introduction II. Estimation of Air Pollutants & GHG Release III. Compliance and Reduction IV. Lessons Learned for Policies
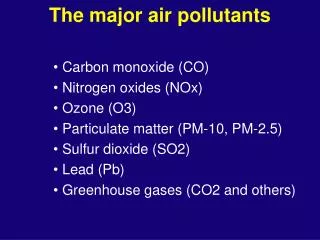
I. Introduction • Korea is the world's 10th largest emitter of greenhouse gas, according to global statistics in 2004. • Chungnam has been functioned as an thermal electric supplier, and settled down as a petrochemical and refinery depot, steel and semiconductor manufacturing complexes as well.
II. Estimation of Air Pollutants & GHG Release • GHG releases are derived from multiplying input fuel quantities by basic emission constants provided by IPCC. • But it is required that GHG releases statistics and inventories to fulfill the reduction plan on the basis of actual survey - GHG releases statistics survey was implemented by practicing CAPSS and TMS by MOE • Other GHG releases except CO2 are estimated by multiplying GWP classification
Emission of GHGs [unit : CO2 eq Million t]
Annual Emission Data 1. Emission Quantity of Air Pollutants [ unit : ton/y ]
Emission in Energy Industry Power generation, regional heating, CHG, oil refinery section is the principal source in Chungnam Province
Aerial distribution of main point sources • - Principal point sources are concentrated in seaside and vicinities around urban areas
Aerial distribution of main line and area sources • Line and area sources are collected in northern area and along the express highways
Annual Trend of Status 2. Emission of GHG in Chungnam Province
GHG emission by energy use GHG emission by power generation [unit : th ton] [unit : th ton]
10 Mt/y above 1 Mt/y above 0.1 Mt/y above • Aerial Distribution of GHG Emission by Main Point Sources
III. Compliance and Reduction 1. Prerequisite issues on reduction of GHG • allowing flexibility to encourage the goals • maintaining energy affordability and reliability • accommodating the diversity of individual sources’ policies and programs • emphasizing uniformity to facilitate the reduction • supporting regional emission trading programs (CDM & ETS)
CCS of GHG • CO2 + Ca2+ + 2OH- → CaCO3↓ + H2O • CO2 + Mg2+ + 2OH- → MgCO3↓ + H2O CCS of Statoil in Norway
Power generation of livestock manure methane gas storage power generation electricity storage fermentation Anaerobic digestion liquid fertilizer • Under construction of biogas power generation plant • Combining of biogas power generation and production of liquid fertilizer
2. Focus on power plants • Releases in power plants account for about 80% of Provincial GHG emission distribution • Power plants are a relatively straightforward sector to address Provincial policies for 3 reasons - Most GHG are generated at a fairly some number of plants - Easy to identify the characteristics for future emission trading - Fundraising sources for the extension of revenue by imposing tax on regional development as an environmental offsets • In contrast, the other sources, such as heating, industrial processes, transportation, and public sectors, are smaller, more numerous, and harder to directly regulate
IV. Lessons Learned for Policies • Choice and Concentration - GHG emission of 6 locations including Dangjin, Taean, Boryeong and Seocheon is derived from thermal power plant as an energy industrial section, and power generation quantity 78 billon kwh occupies 37.3% of nationwide level. - Total amount of GHG emission in Chungnam Province in 2005 occupies 12.3% of nationwide emission. • Linking air pollution reduction policies - Chungnam Province has a great deal of weight in thermal power generation and industrial combustion, it is much higher 85% compared with than that of 32% in the Greater Seoul Metropolitan Area.
Establishment of DB for the management of GHG - Establishment of integrated DB system along the sources as a main countermeasure, overcoming the crisis turns to opportunity for attenuation of economic impact with the effectuation of the Kyoto Protocol. • Establishment of framework for governance on climate change - Cooperation among the stakeholders within the boundary of Province • Environmental economic approach • - Chungnam Province prepares to apply ETS & total air pollution load management system