Download
1 / 29
300 likes | 522 Views
Emission of pollutants into the atmosphere . Katarina Mareckova, EMEP Centre on Emission Inventories and Projections 4 July 2012, Geneva TF on Indicators . Introduction Estimation and reporting of emissions What is NIS and why we need it

E N D
Emission of pollutants into the atmosphere Katarina Mareckova, EMEP Centre on Emission Inventories and Projections 4 July 2012, Geneva TF on Indicators
Introduction Estimation and reporting of emissions What is NIS and why we need it Status of reporting under CLRTAP in EECCA and WB Indicators Content
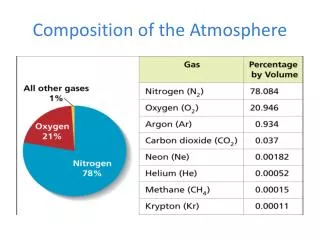
Emission sources • Releases to air occurring by anthropogenic activities (combustions of fuels, agriculture activities, mining, industrial processes, leakages from equipment's, pipelines…) • Natural emissions (volcano eruptions, forest fires, releases from soil, vegetation,.. Type of source • Point sources • Area sources • Linear sources (diffuse emissions)
Emission estimation • Direct measurements of emissions e.g. in chimney measurements • Estimation by calculation • Emission factor (mass pollutant per unit activity) • Activity data • Inversemodeling (e.g. based on air quality measurements)
Quality parametersof emission inventory Quality control T TCCCA • Timeliness • Transparency • Consistency • Comparability • Completenessand • Accuracy • Review process of emissions inventories is established under all Conventions and Protocols • Automated tests on imported data: format, timeliness, trends… • Semi-automated tests on completeness, consistency ,IEF, recalculations,… • In-depth review of methods, EF and AD, documentation…
What is National Inventory System (NIS) • A national inventory system incorporates all the elements necessary • to estimate, • report • and archive emissions and sinks, i.e. Legal arrangements Institutionalarrangements Procedural arrangements High quality inventory that meets needs of policy-makers, researchers and public
Institutionaland procedural arrangements Data providers (StatOff, Industries, … Cooperating institutions Leading institution Team coordinator Universities Consultants Sectoral experts QA/QC manager DB manager Research inst. Strategy / workplanin place Documentation and Archiving system in place QA/QC plan developed Reporting system in place
How could it work Assessment of current status Develop improvement strategy Inventory Planning Inventory Management Inventory Preparation High quality inventory that meets needs of policy-makers, researchers and public
Existing reporting obligation • LRTAP Convention (21 pollutants: acidifying, ozone precursors, PM, HMs, POPs); 51 Parties • 8 protocols • UNFCCC (GHGs: CO2, N2O, CH4, F-gases) 123 Parties • Kyoto protocol • Montreal protocol – Ozone depleting pollutants • Aarhus Convention - • E-PRTR protocol – industrial point sources – 91 pollutants • ……. • EIONET framework (EEA) – annual priority data flows
Overview of reporting under CLRTAP in 2010; EECCA and WB countries
Data flow MS inventories MS inventories MS inventories Parties to the CLRTAP UNECE Secretariat Notificationforms testing Country reports inventories RepDab Central DB Status reports EMEP SB Eurostat EMEP EB Gridded data Surrogate data review CRF, NECD modelers EEA, ETC ACM
Guidebooks and Tools • EMEP/ EEA Inventory Guidebook 2009http://www.eea.europa.eu/publications/emep-eea-emission-inventory-guidebook-2009 • http://www.eea.europa.eu/publications-ru/emep-eea/ • EMEP Emission Reporting Guidelines ECE/EB.AIR/97http://www.ceip.at/fileadmin/inhalte/emep/reporting_2009/Rep_Guidelines_ECE_EB_AIR_97_e.pdf • COPERT road transport software • CollectER emission inventory DB E-PRTR Guidance
Existing Guidebooks and tools • UNFCCC reporting guidelines • IPCC Inventory Guidebooks and IPCC Good Practice Guidancehttp://www.ipcc.ch/ipccreports/methodology-reports.htm • IPCC Softwarehttp://www.ipcc-nggip.iges.or.jp/software/new.html
Existing reporting formats • NFR/CRF sectors, categories • E-PRTR activities
IMPORTANT NOTE • Do not start to develop new emissions/ emission inventory system before assessing previous relevant activities in your country • Establish cooperation , use existing experience of inventory experts in your country, • Support your national inventory experts by providing activity data in required formats and on time
Emission trends • Trends in air quality • Implementation of abatement measures • Economical development
Difference 1990-2010, and Distance to GP Target (2010 emissions to ceilings) Compliance with international treaties
Identification of main sectors to total emissions • S1-Combustion in energy and transformation industries, • S2-Non-industrial combustion plants, • S3-Combustion in manufacturing industry, • S4-Production processes, • S5-Extraction and distribution of fossil fuels and geothermal energy • S6-Solvent use and other product use, • S7-Road transport • S8-Other mobile sources and machinery, • S9-Waste treatment and disposal • S10-Agriculture
Key categories 1A1a Public Electricity and Heat Production”, “1A fi Stationary Combustion in Manufacturing industries and Construction: Other” “2C1 Iron and Steel Production”. 1A2b Stationary Combustion in Manufacturing Industries and Construction: Non-ferrous Metals 1A4bi Residential: Stationary plants
Spatial distribution of emissions max max SOx NH3 min min
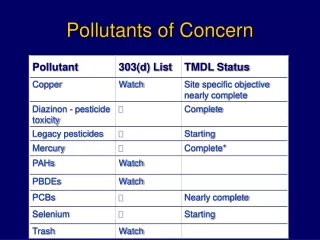
Distribution of LPS, 2012 PM MAIN HM POPs
Large industrial facilities with releases to air (cca 27 000) E-PRTR 2009
Discussion items • How to ensure /improve communication between data providers and inventory compilers • How to improve quality of reported emissions • Where are the problems ? • AD : accessibility, availability, completeness, confidentiality, ….. • EFs : applicability, uncertainty,…. • Tools: guidance, software, literature, database,.. • Legal barriers,… • awareness of decision maker, data providers… • What can we do?