Download
1 / 16
160 likes | 194 Views
Learn about acceptance sampling systems for continuous production and variables. Explore CSP-1, CSP-2, CSP-3 plans, and multilevel continuous sampling. Understand advantages and disadvantages of variables acceptance sampling.

E N D
Acceptance Sampling Systems For Continuous Production and Variables Outline • Acceptance Sampling For Continuous Production • Acceptance Sampling For Variables
Acceptance Sampling For Continuous Production • When production is continuous, many manufacturing operations do not create lots. If conveyor lines are used, it may be impracticable to form inspection lots. In such cases, acceptance sampling plans for continuous production are required. • Plans for continuous production consists of alternating sequences of sampling inspection and screening (100%) inspection. These plans usually begin with 100% inspection, and if a stated number of units (clearance number, ) is free of defects, sampling inspection is started. Only a fraction, of the units are inspected while sampling continues. Sampling continues until a specific number of defectives are found, at which time 100% inspection is restarted.
Acceptance Sampling For Continuous Production - CSP - 1 • The concept of sampling for continuous production was first devised by H.F. Dodge in 1943. His sampling plan, CSP-1 is as follows: 1. Begin with 100% inspection until units in succession are found clear of defects 2. Stop 100% inspection and inspect only a fraction of the units 3. If a defective item is found, stop sampling inspection and revert to 100% inspection. Replace defective items with the good ones and repeat the process starting Step 1.
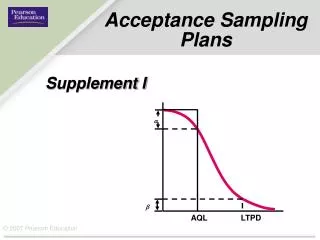
Acceptance Sampling For Continuous Production - CSP - 1 • CSP-1 plans are indexed by AOQL. For a particular AOQL, there are different combinations of and , which may be obtained from Figure 14-1. • Example: If AOQL=1% and find • From Figure 14-1, AOQL=1% and meets at • This plan specifies that sampling inspection of 1 out of every 4 units will start after 60 consecutive items are free of defectives
Acceptance Sampling For Continuous Production - CSP - 2 • CSP-2 differs from CSP-1 in that, once sampling inspection is started, 100% inspection is not invoked when each defect is found but is invoked only if a second defect occurs in the next or less sample units. Usually, • See Table 14.1 and Figure 14.2.
Acceptance Sampling For Continuous Production - CSP - 3 • CSP-3 is a refinement of CSP-2 to provide greater protection against a sudden run of bad quality. When one sample defective is found, the next four units from the production line are inspected. • If none of the four units are defective, the sampling procedure is continued as in CSP-2. • If one of the four units is defective, 100% inspection is resumed at o once and continued under the rules of CSP-2. For a given value of and AOQL, the value of (as well as ) is the same in CSP-2 as it is in CSP-3. • See Table 14.1 and Figure 14.2.
Acceptance Sampling For Continuous Production - Multilevel Continuous Sampling • Sometimes it is desired to start with a large fraction sampled. Economies can be obtained by permitting a subsequent change to a smaller sampling fraction whenever the observed quality is good. Multilevel sampling can provide such economies. • The plan starts with 100% inspection that continues until acceptable units have been found in succession. Then, sampling inspection is initiated with a fraction inspected. If acceptable units have been found in succession, subsequent inspection is at . After another acceptable units sampling inspection is carried out at , and so on. When a unit is rejected, inspection is shifted back to the next lower level.
Acceptance Sampling For Continuous Production - Multilevel Continuous Sampling • The above description of multilevel continuous sampling does not include idea of inspecting four successive units after a defective is found. • See Table 14.2 and Figure 14.3 for a continuous sampling plan that includes an inspection of four successive units after a defective is found.
Acceptance Sampling For Variables • Advantages: • Better quality protection and smaller sample size: for a given quality protection against various possible percentages of defectives, the sample size is considerably less than that of attribute sampling • Gives more information for decision making • Provides a better basis for improving quality • Provides a better basis for giving weight to quality history in acceptance decisions
Acceptance Sampling For Variables • Disadvantages • Cannot be used if quality characteristics are observable only as attributes e.g., color • Only one characteristic can be evaluated • A separate plan is required for each quality characteristic • Involves greater administrative, clerical, equipment, and inspection costs • The distribution of population has to be known or estimated
Acceptance Sampling For Variables • There are four types of acceptance sampling plans for variables. These plans summarize sample information differently: • Frequency distribution of the sample measurements • Shainin lot plot method • Control chart plot of sample means and ranges • Sample average • Sample average and sample dispersion
Acceptance Sampling For VariablesShainin Lot Plot Method 1. A random sample of 10 subgroups of 5 each for a total of 50 items is obtained from the lot 2. The average and range are calculated for each subgroup 3. A histogram is constructed. The Shainin plan states that the number of histogram cells should be between 7 and 16. For example, there are 11 cell in Text Figure 15.1, p. 563.
Acceptance Sampling For VariablesShainin Lot Plot Method 4. The average of the averages, and the average of the ranges, are Where is the number of subgroups 5. Using these values, the upper lot limit (ULL) and lower lot limit (LLL) are calculated as follows:
Acceptance Sampling For VariablesShainin Lot Plot Method Lot Plot Evaluation: Once the lot plot and the lot limits are obtained, the decision concerning acceptance or non-acceptance is made. The decision is based on a comparison of the lot plot with 11 different types of lots, which are shown in Text Figure 15.2 p. 565 1. Lot plot is within specification limits, accept. 2. Lot limits are within specification limits, accept. 3,4. A review board makes an acceptance/rejection decision.
Acceptance Sampling For VariablesShainin Lot Plot Method • The other types of lot plots are used for non-normal distributions and special rules are required for estimating lot limits. 5,8. Skewed 6,9. The lot plot indicates that the lot was screened or sorted. 7,10. Bimodal 11. The lot plot indicates stray values
Reading and Exercises • Chapter 14 • Reading: pp. 542-550 • Problems: 14.1, 14.2, 14.4, 14.9 • Chapter 15 • Reading: pp. 559-566 • Problems: 15.3 (ignore the solution given in the solution manual, use the method in pp. 404-405 of the handout)