Performance Analysis of SALT 2012-1 Semester: Seeing Conditions and Observational Efficiency
50 likes | 182 Views
The SALT 2012-1 Semester Report assesses the performance of the telescope from May to October 2011 and September to April 2012, focusing on seeing conditions and observational statistics. It reveals median seeing values of 1.66" and 1.38", highlighting consistently worse seeing compared to long-term DIMM measurements. The report explains the degradation between ideal and actual image quality, providing insights into the efficiency of observing processes with a total of 408 hours observed from an expected 551 hours. The overall efficiency is measured at 74%.

Performance Analysis of SALT 2012-1 Semester: Seeing Conditions and Observational Efficiency
E N D
Presentation Transcript
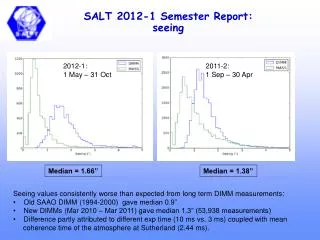
SALT 2012-1 Semester Report:seeing 2012-1: 1 May – 31 Oct 2011-2: 1 Sep – 30 Apr Median = 1.66” Median = 1.38” • Seeing values consistently worse than expected from long term DIMM measurements: • Old SAAO DIMM (1994-2000) gave median 0.9” • New DIMMs (Mar 2010 – Mar 2011) gave median 1.3” (53,938 measurements) • Difference partly attributed to different exp time (10 ms vs. 3 ms) coupled with mean • coherence time of the atmosphere at Sutherland (2.44 ms).
SALT 2012-1 Semester Report:seeing vs. telescope delivered image quality Sep – Nov 2011 ~1.2x degradation between ideal seeing limited images and real telescope images. 1.1 – 1.2 x degradation between zenith seeing and seeing at telescope airmass (1.2 – 1.4) Rule of thumb: BEST expected IQ is ~1.4 x actual DIMM seeing value (for perfectly aligned primary mirror array) For 2012-1, this implies expected median IQ is 2.3”. One reason why poor seeing programs were more successful.
SALT 2012-1 Semester Report:observing statistics Previous semester 2011-2 (Sep 2011 – Apr 2012):
SALT 2012-1 Semester Report:completion statistics Expected total observed: 58% of 950h = 551 h Actual total observed: 408 h “Efficiency”: 74% (<100% due to overheads & rejected blocks)