
Uploaded by
winter-marsh
6 SLIDES
197 VIEWS
60LIKES
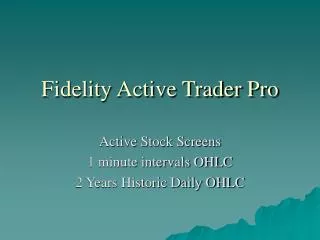
Fidelity Active Trader Pro
DESCRIPTION
This summary provides a detailed overview of Active Trader Pro's historical stock data. It focuses on 1-minute interval OHLC (Open, High, Low, Close) data for a specified stock over the past two years. The stock's performance during this period includes an opening price of 55.49, a high of 55.52, a low of 54.44, and a closing price of 55.40. This information is crucial for active traders seeking to analyze price movements and make informed trading decisions.
Download
1 / 6
Download Presentation 
Fidelity Active Trader Pro
An Image/Link below is provided (as is) to download presentation
Download Policy: Content on the Website is provided to you AS IS for your information and personal use and may not be sold / licensed / shared on other websites without getting consent from its author.
Content is provided to you AS IS for your information and personal use only.
Download presentation by click this link.
While downloading, if for some reason you are not able to download a presentation, the publisher may have deleted the file from their server.
During download, if you can't get a presentation, the file might be deleted by the publisher.
E N D
Presentation Transcript
Fidelity Active Trader Pro Active Stock Screens 1 minute intervals OHLC 2 Years Historic Daily OHLC
Open: 55.49 High: 55.52 Low:54.44 Close: 55.40


More Related
Audio
Live Player