Download
1 / 23
230 likes | 344 Views
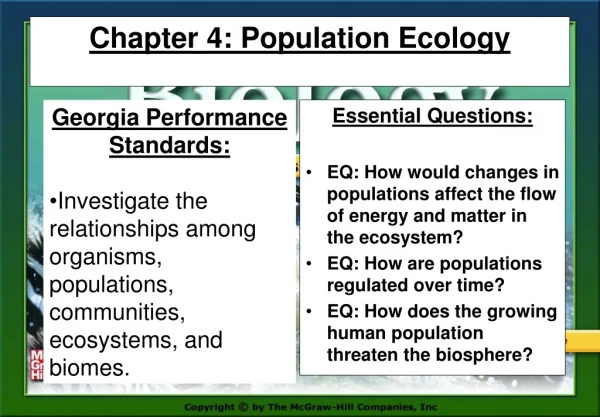
Learn about population dynamics, density, distribution, and growth rates of species. Explore factors affecting population ranges and limitations, including density-dependent and density-independent factors. Understand exponential and logistic growth models and carrying capacity in ecosystems.

E N D
CH. 4.1 – POPULATION DYNAMICS • Main Idea – populations of species are described by density-spatial distribution, and growth rate. • QUESTION: What are some observations you can make about populations of insects over the course of a year? • Do the insects die out completely in winter?
POPULATION CHARACTERISTICS • All species occur in groups called populations. • Each population have similar characteristics such as: • Density • Spatial distribution • Growth rate • Populations are classified according to the characteristics above
POPULATION DENSITY • Population density is the number of organisms per unit area. • Population density is figured out by using this formula: • Pop. Density = # individuals unit area • Ex: 100 cheetahs in our 400 acre park=1 cheetah per 4 acres
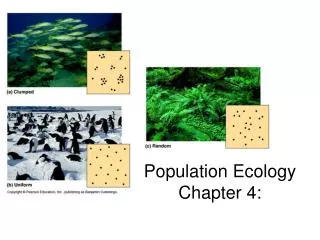
SPATIAL DISTRIBUTION • Dispersion is the pattern of spacing of a population within an area. • 3 main types of dispersion are: • Uniform • Clumped groups • Random • One of the primary factors in the pattern of dispersion is the availability of resources like food.
POPULATION RANGES • No population, not even humans, occupies all habitats in the biosphere. • Some species have a very limited range, other species can have a vast distribution • EX: honeycreeper only on 1 Hawaiian island, peregrine falcon on every continent, except Antarctica. • Organisms adapt to the biotic and abiotic factors in their environment • Limitations to expanding your range can depend on whether you can adapt to the abiotic conditions found in the expanded range. • Includes temperature range, humidity level, sunlight, etc. • Biotic factors like predation, competitors, parasites, can make survival in the new location difficult.
POPULATION-LIMITING FACTORS • Limiting factors are biotic or abiotic factors that keep a population from continuing to increase indefinitely. • Changing the limiting factors will either increase or decrease a population. • QUESTION: Imagine you are at a birthday party. How many people could come before there was not enough cake for everyone?
DENSITY-INDEPENDENT FACTORS • Density-independent factors are any limiting factors in the environment that does not depend on the number of members in the population per unit area. • Usually abiotic factors such as weather events, such as: drought, flooding, extreme heat or cold, tornadoes, and hurricanes • Humans can also unintentionally create alterations of the landscape • Dams (changes water flow & T) • Introduce non-native species • Air, land, & water pollution • Reduces resources because some are now toxic
DENSITY-DEPENDENT FACTORS • Density-dependent factors is any factor in the environment that depends on the number of members in a population per unit area. • Density-dependent factors are usually biotic factors such as: • Predation • Ex: Wolf/moose study • Disease • Outbreaks of disease increase as populations so up because you are closer together • Parasites • Occurs similar to the affects of a disease • Competition • Higher the population the less resources there are to go around
POPULATION GROWTH RATE • Population growth rate will explain how fast a population grows. • Factors that affect growth can be number of births & deaths • Emigration which is when an individual will move out of the population • Immigration is when individuals move into a population
EXPONENTIAL GROWTH MODEL • Exponential growth occurs when there are no limits placed on the population by the environment. • Such as food, water, shelter, mates • Population will grow slowly at first and then increase rapidly • Graph will have a J-shaped appearance. • Growth will only slow when resources become limited
LOGISTIC GROWTH MODEL • Logistic growth occurs when the populations growth slows or stops following exponential growth. • Population has reached the carrying capacity • Develops an S-shaped curved graph • Logistic growth happens when there are less births than deaths or more emigration than immigration.
CARRYING CAPACITY • Carrying capacity is the maximum number of individuals in a species that an environment can support for the long term. • Limited by available energy, water, oxygen, and nutrients • Once a population exceeds the carrying capacity you see more deaths than births • Carrying capacity explains why populations tend to stabilize Carrying capacity
QUESTION? • Discuss together and come up with answer to the following question. Be prepared to support your answer with information from the text: • Hypothesize what might happen to a population that has reached its carrying capacity if a competing species emigrated from the environment.
SECTION 4.2 – HUMAN POPULATION • MAIN IDEA – Human population growth will change over time. • Your perception of human population growth might be different if you lived in one of the world’s largest cities such as Mexico City with a population of 17 million or in a small town such as Dellview, North Carolina, with a population of 16. • QUESTION: No matter where you live, would you say that the total population is growing faster today or that it grew faster 50 years ago?
HUMAN POPULATION GROWTH • Demography is the study of human population size, density, distribution, movement and birth and death rates. • Demographers keep track of the population size and have charted the size over millions of years. • Population in 2012 is estimated to reach 7 billion people • Population in 2050 is estimated to reach 9 billion • Figure 11 on pg. 100, what type of graph is shown?
TECHNOLOGICAL ADVANCES • For a long time environmental conditions kept the size of the human population at a constant number below the carrying capacity. • Now we alter the environment that has changed the carrying capacity • Agriculture • Farm animals • Technological advances and medicine have improved the survival rate for humans • Improvements in shelter makes humans now less vulnerable to climate impact
HUMAN POPULATION GROWTH RATE • Human population is still growing, but the rate of growth has slowed • Reason for the decline in the rate of growth in the US is AIDS and voluntary population control
TRENDS IN HUMAN POPULATION GROWTH • Population trends can be altered by events such as disease and war. • Historical events have changed populations trends, such as the industrial revolution • Human population growth is not the same in all countries • But you will see similar population growth trends in similar economies • Demographic transition is the change in a population from high birth and deaths to low birth and deaths • Developing countries add more people to the world population vs. industrial countries, pg. 103, Table 1
ZERO POPULATION GROWTH • Zero population growth (ZPG) occurs when births plus immigration equals deaths plus emigration. • Estimated that the world population will reach zero population growth between 2020 with 6.64 billion people and 2029 with 6.90 billion people.
AGE STRUCTURE • Population’s age structure is the number of males and females in each of 3 age groups: • Pre-reproductive stage • Before age 20 • Reproductive stage • Between the ages of 20 & 44 • Post reproductive stage • After age 44 • Represented by an age structure diagram • Looks different • Depends on if the country is experiencing rapid growth or zero population growth
HUMAN CARRYING CAPACITY • Human population will reach or exceed carrying capacity • As population reaches carrying capacity, areas will be become overcrowded and disease and starvation will occur. • Technology continues to increase the level of carrying capacity • Depends on how much resources are used by each person • Industrialized countries use more resources than developing countries • As developing countries become industrialized, more demand is put on resources