Download

1 / 49
490 likes | 647 Views
Overview of Simulation Models and a Simulation Model for NHIS Field Operations and Cost Estimates. Bor-Chung Chen Office of Railroad Safety Federal Railroad Administration/USDOT April 7, 2011. Staff Allocation Models. Risk and Safety Safety Data Risk/Reliability Data Safety Data-Driven

E N D
Overview of Simulation Models and a Simulation Model for NHIS Field Operations and Cost Estimates Bor-Chung Chen Office of Railroad Safety Federal Railroad Administration/USDOT April 7, 2011
Staff Allocation Models • Risk and Safety • Safety Data • Risk/Reliability Data • Safety Data-Driven • Workload and Activities • Inspector Activity Report Data • Demand-Driven • Required by Regulations/Law
Example Model (1) • NIP (National Inspection Plan) Staff Allocation Model • Minimize damages of railroad accidents • Regression analysis is used based on injuries/fatalities data • Constraints on specified percentage changes of current inspector position slots
Example Model (2) • Transportation Security Administration’s Staff Allocation Model • Three Components: • GRA Flight Data by GRA, Inc.: baggage volume, flight & passenger distribution, and load factor • Regal Software by Regal Decision Systems: airport configuration and screening process • Sabre Software by Sabre Airline Solutions, Inc.: scheduling process to determine staff needed in waiting time of 10 minutes (or 5) or less.
Example Model (3) • Positive Train Control (PTC) Staff Allocation Model • Four PTC Components: • Dispatch Center • Communication Systems • Locomotive Units • Wayside Units • Appropriateness/Effectiveness Index Score • Maximize the total score of all inspector assignments to all inspector activities. (To allocate the skilled inspectors to the inspection activities in reaching the most effective performance) • Constraints
Simulation Modeling An Operations Research Method Optimization Save Resources and/or Improve Data Quality
Operations Research (OR) seeks the determination of the best (optimum) course of action of a decision problem under the restriction of limited resources
An optimization model is a decision-making tool that recommends an answer (the goal to be optimized) based on analyses of information (constraints and decision variables). It consists of three components: • The goal to be optimized, • Constraints, and • Decision variables
Operations Research Models • Deterministic Models • Linear Programming Models • Integer Programming Models • Network Flow Programming Models • Nonlinear Programming Models • Stochastic Models • Inventory Models • Queueing Models • Queueing Networks and Decision Models • Simulation Models
Types of OR Models • Analytical Models: • The objective and constraints of the models can be expressed quantitatively or mathematically as functions of the decision variables. • Simulation Models: • The relationship between input and output of the models are not explicitly stated; the models break down the modeled system into basic or elemental modules that are then linked to one another by well-defined logical relationships.
System Queue or Service Facility Waiting line 1 Arriving x x x x x x 2 Departing Customers Customers . . . c An M/M/c Queueing System
Performance Measures of Queueing Systems Arrival rate Departure rate Server utilization Expected number of customers in queue Expected number of customers in system Expected waiting time in queue Expected waiting time in system
Total Cost of A Queueing System (Taha[2011]) Cost of Waiting Total Cost Cost of Operation Cost Per Unit Time Optimum Number of Servers (Tellers) Number of Servers (Tellers)
Queueing Systems The customers come to the servers The system is small and simple No traveling time involved Field Operations (Personal Visits) The servers (interviewers) go to the customers (respondents) The system is very large and complicated Server traveling time Queueing Systems vs. Field Operations
Inbound 800 Customer Services Help Desks Outbound Telemarketing Telephone Surveys Charities Politicians Some Companies Inbound vs. Outbound Telephone Call Centers
Outbound Telephone Dialing Systemas a Closed Queueing Network (Samuelson[1999]) NA D Queue or Waiting Line Service Facility Party Does Not Answer 1 W 2 A x x x x x x Waiting To Dial . . . Party Answers c Lines with Parties Who Hang Up or Get Turned Away N S R
Outbound Telephone Dialing SystemDecision Variables • Amount of time to anticipate service completions • Obtaining the new party too early, resulting in an abandoned call and the need to start dialing again • Cost of waiting too long, resulting in unnecessary idle time for the representatives • Number of calls to attempt at once • Two or more answer, we will have one or more abandoned calls • None answers, we will have idle representative time
Objectives • Develop a valid method of predicting cost, response rates, and timing of new or continuing surveys for the field operations. • The simulation modeling will be followed by the optimization of the field operations if a simulation model is feasible and valid.
Definition of Discrete-Event Simulation • Event Driven: Each occurrence of an event changes the state of the system • Using a model (implemented as a computer program), rather than experimenting with a real system
Steps of Simulation Study (Banks 1998) • Model Conceptualization • Data Collection • Input Data Analysis • Model Translation • Verification and Validation • Experimental Design • Production Runs and Output Analysis
Model Conceptualization • Problem Formulation • Objectives and Project Plan • The modeling begins simply and the model grows until a model of appropriate complexity has been developed with the objectives in mind.
Data Collection • A data set for each variable from a survey is collected. • Whenever possible, collect between 100 and 200 observations. • Collect a number of samples from different time periods, such as field operations (time of day and/or day of week)
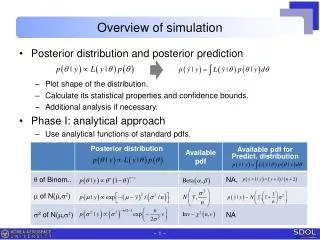
Input Data Analysis and Modeling • Assessing Independence • Probability Plots • Estimation of Parameters • Goodness of Fit Tests • Empirical Distributions • Simulation Support Software • ExpertFit (A. M. Law and Associates) • Stat::Fit (Geer Mountain Software Corporation)
Model Translation • The conceptual model constructed is coded into a computer-recognizable form, an operational model. • General-Purpose Software • Manufacturing-Oriented Software • Business Process Reengineering • Simulation-Based Scheduling • Field Operations? C++, FORTRAN?
Random Number and Random Variate Generation • Random (pseudorandom) numbers between 0 and 1 from the uniform distribution, U(0,1) or RN(0,1) • Use Inverse Transform Method to obtain a random variable, X: otherwise
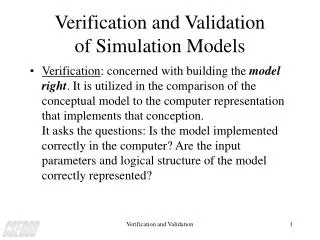
Verification and Validation • Verification concerns if the operational model is performing properly. • Validation is the determination that the conceptual model is an accurate representation of the field operations (or the real system).
Verification and Validation Process • It is an iterative process: • Add new details to the model • Run the model • Evaluate the results • The results are not sufficiently accurate • Identify other details (operations/input data) • Go to step 1 and the cycle starts anew • At some point, the model is determined to be “close enough”
Experimental Design • For each scenario that is to be simulated, decisions need to be made concerning the length of the simulation run, the number of runs (also called replications), the manner of initialization, and controllable decision variables as required.
Production Runs and Output Analysis • Production runs and their subsequent output analysis are used to estimate the performance measures (cost, timing, and response rates) for the scenario that are being simulated. • Finite-Horizon Simulations • Steady-State Simulations
Simulation Model of Simplified NHIS Field Operations (Prototype) • Ten FRs, 1050 cases, 105 cases per FR • Each FR covers a PSU of 60 x 60 square miles • FRs are given 17 days starting from a Monday • All FRs start to work at 3:00 PM each day • 2004 NHIS CHI data set for input modeling • Visiting order: Traveling Salesman Problem • The model: about 1900 lines of C++ code
Field Operation Inputs • Frequency distribution of 28 outcomes • Interview length distributions by outcomes • Contact/No-Contact Bernoulli distribution • Contact time distributions • Uniform distributions for vehicle speed
Software Development for Field Operations Simulation Modeling Field Operations Inputs Input Modeling Field Operations Simulation Model Output Analysis Response Rates Costs Timing
Performance Measures • Low Cost: Direct Labor Cost (Hours and Mileage) • Average number of personal visits per case • High Response Rate • Short Timing: How long it takes each month (17 days) • It is called LHS
Preliminary Results • 1000 independent replications with different seeds • Cost: $25,475 • Based on $10/hr and $0.35/mile • Average number of PV = 1.74 • Response Rate: 86.04% • Timing: 17 days
Design of Experiments:Controllable Parameters • Starting time:10:00 AM, 12:00 noon, and 3:00 PM • Number of FRs: 10 and 15 • Timing: 17 days vs. 11 days • Area: 3600 vs. 2401 square miles • Cases per FR: 105 vs. 70 • FR-Days: 170 vs. 165
Selected Frequency Distributions of Contact (C)/No-Contact (NC)
The Estimates of the PMs of the Six Parameter Settings Adjusted to 170 FR-Days
Federal Statistics in the FY 2010 Budget • Source: http://www.copafs.org/reports/federal_statistics_in_the_fy_2010_budget.aspx
The Estimates of the PMs of the Other Three Parameter Settings
Conclusions • Simulation models can be used for optimizing field operations • Smaller PSU area is more cost effective • Less time on the roads and more time knocking on the doors • Not at the expense of the response rate • Field operations can be completed sooner
Microsimulation of NHIS • Physical Impediments and At-Home Patterns of Households • Interviewer Strategies • Multiple Visits of Completed Interviews • Unrelated Persons Living in the Same House • Classification of Interviewers • Multiple Surveys • Sample Designs
What Next? • Most Recent NHIS CHI Data • Classification of PSUs: • Population Densities • Car Densities • Traffic Statistics • Development of A Simulation Language for Field Operations?
Simulation and Modeling Textbooks • Law and Kelton: Simulation Modeling and Analysis. 3rd edition, 2000, McGraw-Hill • Jerry Banks, Editor: Handbook of Simulation. 1998, Wiley & Sons • Hamdy A. Taha: Operations Research: An Introduction. 9th edition, 2011, Prentice Hall • Hillier and Lieberman: Introduction to Operations Research, 8th edition, 2005, McGraw-Hill
Operations Research Models • Deterministic Models • Linear Programming Models • Integer Programming Models • Network Flow Programming Models • Nonlinear Programming Models • Stochastic Models • Inventory Models • Queueing Models • Queueing Networks and Decision Models • Simulation Models • Field Operating Models?