Download
1 / 7
70 likes | 103 Views
This feature allows users to display and analyze object allocation statistics over time in Java applications. By grouping allocated objects by package and class, users can track live and total objects, average instance age, detect memory leaks, and more. The tool provides detailed information on object allocation, like method names, signatures, source line numbers, and allows users to configure the profiler settings. The interface offers a comprehensive view of memory statistics, enabling users to identify allocation sites and dive into allocation details for selected classes.

E N D
Heap Analysis Enhancements for TPTP 4.4 Asaf Yaffe Software and Solutions Group Intel Corporation
Heap Analysis – Use Cases • Display object allocation statistics over time • Analyze object allocation
Use case – Object Allocation Statistics • Show the following statistical information about allocated objects, grouped by package/class: • Package name • Class name • Number of live (non-collected) objects • Size of live objects • Total number of objects (including GCed) • Total size of objects (including GCed) • Average instance age • Age = number of GCs an object survived • Average age = sum(all ages) / Live Objects • High average age => lingering instances => memory leak? • Number of generations • The number of different ages of live objects • Many generations indicate that new instances are constantly allocated but old instanced are not GCed => memory leak?
Use case – Analyzing object allocations • The user selects a class entry to view the allocation statistics for the class • Allocation information is grouped by allocation site • Same information as in previous use-case, plus • Method name, signature, and defining class (and package) • Source line number (if available) • If source line information is not available for the method, information is grouped by method name
Heap Profiler Configuration • User can decide whether or not to collect object allocation information • Profiler application > Monitor > Java Profiling (Java 5.0 +) > Memory Analysis > Edit Options
Click a column to sort Double click a row to view allocation details (next slide). Available only if “track allocaiton site” option is selected Memory Statistics View
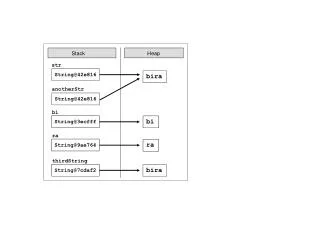
Two allocation sites in function main(). Double click to view source code No source line information for toString(). All information presented in a single allocation site. Double click to view source file (if source file info is available) Allocation Details for a Selected Class