Download
1 / 78
780 likes | 796 Views
Explore how biological data enriches social science research, focusing on the UK Household Longitudinal Study. Discover the links between socioeconomic status, health, and genetics for better policy outcomes.

E N D
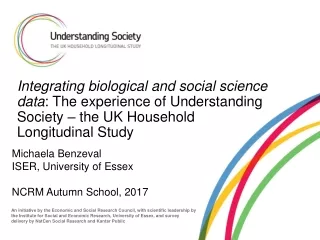
Integrating biological and social science data: The experience of Understanding Society – the UK Household Longitudinal Study Michaela Benzeval ISER, University of Essex NCRM Autumn School, 2017
Structure of session • Brief intro to Understanding Society <5 mins> • Introduction – why are biological data useful for social science? <20 mins> • Questions and discussion: possible research questions <10 mins> • Introduction to biological data in Understanding Society <15 mins> • Questions <5 mins> • Introduction to analysing biological data <10 mins> • Questions and discuss research ideas again <10 mins> • Future opportunities to get involved <10 mins> • Questions
Understanding Society • Understanding Society: the UK Household Longitudinal Study (UKHLS) is a multi-purpose household panel survey begun in 2009 • Wave 1 target: 40,000 households, 100,000 people, multiple samples • Building on the long running British Household Panel Survey (BHPS) established in 1991 • Funded by the UK Economic and Social Research Council and a range of government departments • Publicly available dataset – over 10,500 downloads by 4,000 users (academic 93%, Government 4%, third sector 1.5% and commercial 0.5%) across 38 countries (10%) • Part of ‘family’ of international household panels in USA, Australia, Germany, Canada, Switzerland, China, South Africa, South Korean, Russia…… https://cnef.ehe.osu.edu/ • Conducted additional wave of biological data collection
Multiple samples Initial: • General Population Sample: 30,000 UK households in 2009 (58% household response; 82% adult response = 41,047 interviews) • Ethnic Minority Boost: 1,000 adult individuals across five main ethnic groups (Indian, Pakistani, Bangladeshi, Caribbean, African) (52% household response; 72% adult response = 6,685 interviews) • British Household Panel Survey (1991 - ):approx 8,000 households, 13,454 adults continued in UKHLS (wave 2) • Innovation Panel: 1,500 households, 2,500 adults annual survey preceding main study for experimentation – refreshment samples waves 4,7,10,11 • TOTAL: 39,805 households: 101,087 individuals: 63,755 adults, 5,788 youths New: • Immigrant and Ethnic Minority Boost sample in 2015/6 = 2,900 households, 3213 adults
Ten key features • A representative panel of all ages • Ongoing annual (continuous) data collection • Incorporates the BHPS (started 1991) • The whole household • Large sample • National, regional and local data • Immigrant and Ethnic Minority Boost Samples • Linked administrative data • Innovative and rigorous methods • Multi-topic, including biomarkers genetics, and epigenetics data
Introduction to value of biological data in social science research
The value of integrating social and biological perspectives The biomedical literature has generally treated socioeconomic position as a unitary construct. Likewise, the social science literature has tended to treat health as a unitary construct. To advance our understanding of the relationship between socioeconomic position and health, and ultimately to foster appropriate policies and practices to improve population health, a more nuanced approach is required—one that differentiates theoretically and empirically among dimensions of both socioeconomic position and health. Herd et al 2007, p.223
Biomarkers a characteristic that is objectively measured and evaluated as an indicator of normal biological processes, pathogenic processes, or pharmacologic responses to a therapeutic intervention. National Institute of Health Biomarkers Definitions Working Group (1998)
Why are biomarkers and genetics useful for social science research? • To understand society and health need good measures of both on same population (over time) • Earlier and more precise ‘objective’ measures of health and illness • Understanding the pathways by which social factors are associated with health • Understanding the biological underpinnings of social phenotypes • Gene-environment interactions • Understanding how the environment gets under the skin • Intervention points and risk factors for policy intervention
Why are biomarkers and genetics useful for social science research? • To understand society and health need good measures of both on same population (over time) • Earlier and more precise ‘objective’ measures of health and illness • Understanding the pathways by which social factors are associated with health • Understanding the biological underpinnings of social phenotypes • Gene-environment interactions • Understanding how the environment gets under the skin • Intervention points and risk factors for policy intervention
Examples: how biomarkers, and inequalities in them, differ over the lifespan
The lifecourse and biomarkers Growth Maintenance Decline Early life Old-age Mid-life AGE
Grip strength Caroline Carney, Understanding Society Scientific Conference, 2015
Biomarkers help us understand the pathways by which the environment gets under the skin Source: Davillas et al, 2017
Examples: combining biomarker and self report data to understand illness behaviour
Why/how might biomarkers and self report health differ? • Perceptions of health • Awareness of illness, help seeking behaviour • Self report bias • May all lead to ‘clinical iceberg’ and poor management of illness
Measuring diabetes Females Males
Decomposing the “actual diabetes” prevalence 13% 20% 14% 26% 18% 15% 49% 44%
Associations with SEP (educational level attained) Poorly managed diabetes Undiagnosed diabetes
Examples: combining biomarker and self report data to understand self assessments of health
Why/how might biomarkers and self report health differ? • Perceptions of health • Awareness of illness, help seeking behaviour • Self report bias • May all vary systematically by social groups in ways that inappropriately influence policy Project led by Chaparro, Hughes,Kumari,Benzeval
SRH: In general how do you rate your health? …excellent…fair…. poor • Widely used in social surveys, census, need indicators and resource allocation • Strong evidence it is closely associated with morbidity and mortality • Significant volume research on health and health inequalities relies on it • (Jylhä 2009) People answer this question by: • Considering what concept of health means to them • Considering their health compared to their life stage, peers, needs, etc • Deciding how to put these considerations into scale presented with • … a summary measure of all the dimensions of health that are relevant to the individual respondent (Jylhä et al, 1998) • Not surprising systematic differences by social groups
Examples Do biomarkers give us more confidence about social pathways?
Work and health • People who are in work have better health than those unemployed • Assumed returning to work will improve health • But is all work good for health? • Existing literature looked this with self report data but personality may lead to negative affect ie report poor quality work and health • Biomarkers provide objective measure health to better understand this association • Investigated those out of work in one wave with health in subsequent wave if returned to work or stayed unemployed • Measures of health allostatic load – cumulative burden of stress on physiological systems
Is returning to work good for health? Control for health differences at w1 so unlikely to be selection effect, and age, sex, income , education differences Source: Chandola and Zhang (2017, IJE)
EpigeneticsPredicting biological age using methylation • Epigenetics – investigates degree to which genes are turned on or off • Your epigenetic clock is based on measuring natural DNA methylation levels to estimate the biological age of a tissue, cell type or organ. • Horvath's epigenetic clock was developed by Steve Horvath • Professor of human genetics at UCLA • Based on 353 epigenetic markers on the human genome. • Understanding Society data is missing 17 of the probes needed for this calculation • Horvath's clock has been applied to a number of diseases/traits • HIV, Parkinson's accelerated epigenetic aging • Centenarians age slowly 8.6 years younger • Parts of the brain age differently Source: Amanda Hughes et al, in preparation
Predicted Age in UKHLSHorvath Clock Source: Amanda Hughes et al, in preparation
Predicted Age in UKHLS: Current and childhood SEP Source: Amanda Hughes et al, in preparation
What research questions might you like to ask of biological and social data?
What is a biomarker? • Physical measure – height, BP, grip strength Measures taken from ‘tissues’ – blood, saliva, hair, etc • Clinical indicators of significant diseases eg HbA1c and diabetes, liver function and cirrhosis • Established risk factors for significant diseases eg cholesterol and heart disease • Markers for stress pathways between social and health eg HPA axis, inflammatory markers • Novel markers eg telomere
Nurse interview • Conducted by NatCen • Nurse interview follow up to main interview at wave 2(GPS), wave 3 (BHPS) • Eligibility: took part in main wave interview, Great Britain, English speaking interview • All GPS households wave 2 year 1 • 0.81 sampling fraction wave 2 GPS year 2 • All BHPS sample • Approximately 5 months after main interview • 1 hour interview – physical measures; blood samples, medications, conditions on day
Blood samples • Eligibility: all adults except pregnant women, those with clotting disorders or medication or self declared HIV, Hep B or C • Written consent for ‘unspecified future research use’ and separate consent for DNA extraction • Samples were unfasted , posted to laboratory for processing • On average it took 2.6 days from the time of blood collection to the samples being processed; 90% of samples were processed within 4 days • Blood separated and frozen in small aliquots • Bloods analysed by Newcastle upon Tyne Hospitals NHS Foundations Trust (NUTH) • All tests undertaken to relevant standards with range of internal and external quality assurances processes in place
Criteria for choice of biomarkers • Environmental (socioeconomic, physical, psychosocial) and/or behavioural effect on marker • Evidence of pathways to important health outcomes • Affects reasonable proportion of general population • Has reasonable prevalence among those affected • Can be measured given the way our blood was collected and stored • Core markers for main diseases • Useful as individual measures and/or in combined risk scores • Some novel markers – around biological ageing and stress
Blood analytes Understanding Society: The UK Household Longitudinal Study https://www.understandingsociety.ac.uk/Research Methods Festival, Bath, July 2016
Understanding Society Genetic Data • 9,944 Individuals who also have biomarker data. • Population: England, Scotland and Wales. • Genotyped at the Wellcome Trust Sanger Institute (Genome Research) • Illumina Human Core Exome BeadChip • >500,000 SNPs • >8,000,000 Imputed SNPs 56% 44% Eleftheria Zeggini Karoline Kuckenbäcker Bram Prins www.illumina.com
Understanding SocietyEpigenetic Data • Selected from those who had genetic Data • Blood processed within 1-2 days • British Household Panel Survey (BHPS) • At least 10 years of BHPS data (2/3rds have 20 years) • Data Normalised and cleaned by Tyler Gorrie-Stone, Professor Leo Schalkwyk • 1175 samples • InfiniumMethylationEPICBeadChip • >850,000 methylation sites across the genome • 857,071 sites after QC 58% 42% Professor Jonathon Mill Dr Eilis Hannon Dr Joe Burrage
Understanding SocietyApplying for the data 2 Avenues depending on what is required Avenue 1 • European Genome-phenome Archive (EGA) • https://www.ebi.ac.uk/ega/home • Genetic/Epigenetic data NOT linked to any of the main survey data Avenue 2 • METADAC • http://www.metadac.ac.uk/ • Genetic/Epigenetic data linked to any of our main survey data (income, health, biomarker, socio-economic data) https://www.ebi.ac.uk/ega/studies/EGAS00001001232
METADACEpigenetic, genetic and linked survey data • Anyone within the UK wishing to access the genetic or epigenetic data linked with the end user licence (EUL) survey data must apply to the METADAC. • http://www.metadac.ac.uk/ • METADAC considers complex issues for biomedical data access for a number of longitudinal studies. • Data access committee • Meetings held once a month • Technical review (independent and Understanding Society Team) • We provide a critical evaluation of the application and the variables being requested. • Data provided within 3 months of approval
Introduction to analysing biological data in Understanding Society
Using biomarker data • Usual statistical concerns re outliers, distribution etc • Clinically feasible ranges • Recent events – accidents, operations, smoking, food & alcohol, etc • Context of blood sampling – time of day, room temperature etc • Co-morbidities • Medications • Internationally agreed approaches to standardisation • Clinical cut-offs • Composite risk scores