Innovative W-Band Cloud Radar for Marine Boundary Layer Cloud Observations
The NOAA Physical Science Division has developed a novel pitch-roll stabilized W-band (94 GHz) Doppler radar designed for in-depth research on the dynamics and microphysics of marine boundary layer clouds. This radar provides profiles of full Doppler spectra and allows precise measurements of vertical motion, effectively eliminating tilt contamination from horizontal winds. With a vertical resolution of 25 m and capable of producing data at intervals of 0.3 seconds, this radar significantly enhances our understanding of cloud processes in marine environments.

Innovative W-Band Cloud Radar for Marine Boundary Layer Cloud Observations
E N D
Presentation Transcript
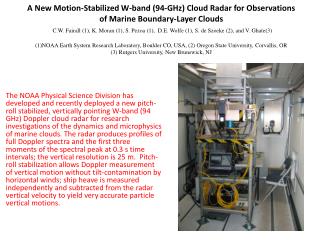
A New Motion-Stabilized W-band (94-GHz) Cloud Radar for Observations of Marine Boundary-Layer CloudsC.W. Fairall (1), K. Moran (1), S. Pezoa (1), D.E. Wolfe (1), S. de Szoeke (2), and V. Ghate(3)(1)NOAA Earth System Research Laboratory, Boulder CO, USA, (2) Oregon State University, Corvallis, OR(3) Rutgers University, New Brunswick, NJ The NOAA Physical Science Division has developed and recently deployed a new pitch-roll stabilized, vertically pointing W-band (94 GHz) Doppler cloud radar for research investigations of the dynamics and microphysics of marine clouds. The radar produces profiles of full Doppler spectra and the first three moments of the spectral peak at 0.3 s time intervals; the vertical resolution is 25 m. Pitch-roll stabilization allows Doppler measurement of vertical motion without tilt-contamination by horizontal winds; ship heave is measured independently and subtracted from the radar vertical velocity to yield very accurate particle vertical motions.
What is a Cloud Radar? • Radar scattering from a distribution of droplets: • Pt=Transmit power, R=range, Ae=Antenna Area, ΔR=Range resolution, Δt=‘Dwell’ time to produce velocity estimate, λ=wavelength, qliq=amount of liquid water per volume, rm=drop radius • Tradeoffs: • Portable – Ae small • Affordable , safe, reliable- Pt small • Resolve processes – ΔR, Δt small • Sensitive – Ae, Pt, ΔR, Δt Large • Rain drops rm=1 mm; Cloud drops rm=0.01 mm. Clouds require 106 more sensitivity. • Solution – λ small. Typically 3 or 8 mm (94 GHz or 35 GHz)
Historical Background Meteorological Cloud Radars • 1950’s TPQ-11 35 GHz radar ‘ceilometer’ for airports • 1983 NOAA-K 35 GHz scanning Doppler radar (100 kw, 1.2 m, 5 sec) • 1987 Lhermitte 94 GHz Doppler • 1995 Moran ARM/MMCR 35 GHz (continuous, spectral processing, 0.1 kw, 1m, 20 sec) • Marine deployments • 1994 Penn State 94 GHz Doppler Monterey Ship Tracks Experiment • 1999 NOAA/PSD 35 GHz MMCR JASMINE (Indian Ocean); [2000, 2001, 2004, 2008] • 2008 NOAA/PSD 94 GHz VOCALS Marine Stratus (stabilized, 1.2 kw, 0.25 m, 0.3 sec) MMCR PSD Wband NOAA-K
Doppler Spectrum Moment Processing Three Basic Moments: Mean Doppler Velocity (Va=W) Doppler width (σw) Backscatter (dBZ)
Time-Height Cross Section Cloud Views Time-height cross section from 1 hour of data beginning at 0600 on Nov. 28 (Day 333) from ESRL/PSD W-band cloud radar. The top panel is the radar reflectivity (dBZ); the middle panel is the mean Doppler velocity (m/s, positive down); the bottom panel is the Doppler width (m/s) of the return. Time series of ceilometer cloudbase height for Nov. 28.
Example cloud/drizzle Effects Nov 18 no rain Nov 20 rain
Joint dBZ-Velocity Distributions As Function of Height in the CloudFrom cloudtop down, 200 m height bins Zbase=1.0 km
Joint dBZ-Velocity Distributions As Function of Height in the Cloud From cloudtop down, 200 m height bins Zbase=1.3 km
Linking Cloud Microphysics and Liquid Water Figure. (a) Mean reflectivity from the W-band cloud radar for November 12-15. Thin lines are cloud top height estimated from the radar and cloud base height from the ceilometer. (b) Liquid water path (LWP) from the microwave radiometer (red) and adiabatic LWP from cloud thickness (blue). Bars in (c) show the frequency of occurrence in hours of column maximum reflectivity (dBZ) of 1-minute samples for all 538 hours of the VOCALS cloud radar record. The median and range of 10-minute LWP (g m-2, red dots and lines) are binned by column maximum reflectivity.