Download
1 / 1
10 likes | 131 Views
This course provides a comprehensive introduction to managing and visualizing data using MS Excel, alongside web design principles and practices using HTML and JavaScript. You will learn to create dynamic webpages for enhanced interactivity, visualize data effectively with charts and graphs, and present information engagingly using MS PowerPoint. Additionally, the course covers basic programming concepts with Alice for animation, desktop publishing in MS Word, and web development essentials to create user-friendly interfaces.

E N D
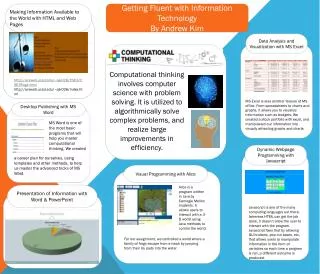
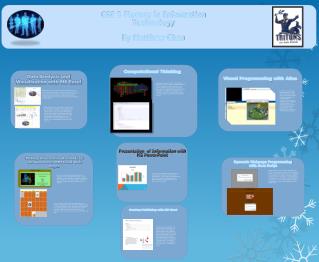
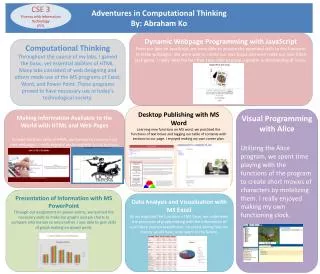
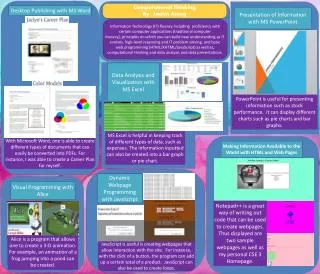
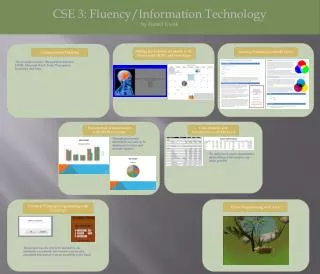
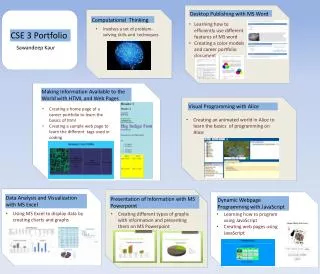
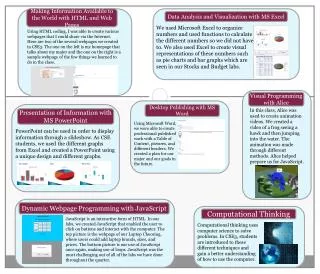
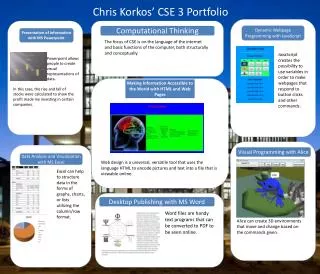
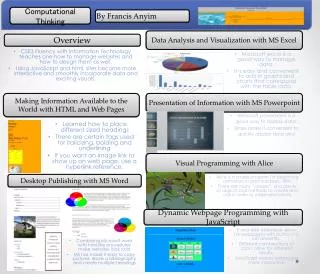
Computational Thinking By Francis Anyim Data Analysis and Visualization with MS Excel Overview CSE3 Fluency with Information Technology teaches one how to manage websites and how to design them as well. Using JavaScript and html, sites become more interactive and smoothly incorporate data and exciting visuals. Microsoft excel is a good way to manage data. It is easy and convenient to add in graphs and charts that correspond with the table data. Making Information Available to the World with HTML and Web Pages Presentation of Information with MS Powerpoint Microsoft powerpoint is a good way to display data. Slides make it convenient to quickly display data and Visual Programming with Alice Alice is a simple program for beginning animators to practice basic skills. There are many “classes”, and plenty of objects and methods to create and call in order to make animations Desktop Publishing with MS Word Learned how to place different sized headings There are certain tags used tor italicizing, bolding and underlining If you want an image link to show up on web page, use a hyperlink reference. Dynamic Webpage Programming with JavaScript If and else staements allow for webpages with buttons to run smoothly. Different combinations of clicks allow for different results. JavaScript makes webpages more interactive Combining Microsoft word with html-like procedures make websites look cool MS has made it easy to copy pictures, leave a bibliography and create multiple headings